This Toxic Tar
Spoiler Alert: Our experiments are showing tar balls washing up on our beaches to be toxic to our local sand crabs. If you are looking for that info, scroll to the Tar’s Toxicity heading at bottom of this post. If you want get a brief primer on Ecotoxicology, then start right here…
A brief history of poisons: French Regicide to New York City

Françoise Athénaïs de Rochechouart de Mortemart, marquise of Montespan (5 October 1640 – 27 May 1707), mistress of King Louis XIV of France during Affair of the Poisons which ran from 1677–1682.. Image Source: Wikicommons
Our modern understanding of toxins in the western world traces back to the proliferation of targeted poisonings across Europe several hundred years ago. The Europe of 500 years ago was dominated by monarchies where royal houses typically bred with only a handful of other royal houses. Only a very select few of those offspring were in turn able to become the ultimate ruler (the king or queen) of kingdom X or empire Y. Those kings and queens tended to hold their position for life. Add in the fact that the royal courts and/or church didn’t typically take kindly to a next in line for the throne offing the king or even the apparent or king just so they could move into that anointed position. Would be rulers were therefore in something of a tight spot. What was a scheming, covetous, inbred to do? Cue the dramatic music and the rise of the widely popular art of poisoning your older sister or brother in ever uneventful ways and with ever more creative toxins. This forerunner of our modern field of toxicology spurred numerous clandestine experts who knew of the right amount of substance X and how to deliver them in unseen ways so as to produce the funeral you desired. Examples ranged from the tabloid Affair of the Poisons (a huge French scandal spanning 1677–1682 that led to the execution of 36 courtesans) to the more “traditional” politically calculated killings such as that of Moscow’s Dmitry Shemyaka in 1453.
It was all very Game of Thrones-esque.

Alexander Gettler (far right) and Charles Norris (seated, left) in the toxicology laboratory located on the third floor of the City Morgue, Bellevue Hospital circa 1922. Image source: Wikimedia Commons.
While medieval courtesan intrigue way over in Europe may seem only tenuously related to our modern field of ecotoxicology, it quite literally laid our foundations. First and foremost this gave us the central underpinnings of toxic exposure. This concept would eventually become more widely known now as a Dose-Response Curve. The idea here is that almost any substance can be lethal in high enough quantities. The corollary is that any poison can cause you no harm if you get exposed to it in small enough quantities.
The classic Dose-Response Curve began to take on the cloak of scientific rigor with the birth of the modern forensics unit in New York City at the turn of the 20th century. Alexander Gettler became the first professional forensic toxicologist in the United States, employed by New York City between 1918 and 1959. Gettler, his boss Charles Norris (America’s first medical examiner to work with rigorous, scientific methods), and their colleagues established a laboratory which (among other things) quantitatively explored the Dose-Response Curves for a wide range of substances. Much effort went into characterizing toxins via the types of toxic response they manifest in the target organism (see my figure below). If this is even vaguely of interest to you, I’d HIGHLY recommend The Poisoners Handbook by science writer and Pulitzer-Prize winner Deborah Blum.

Three potential Dose-Response Curves. The dose (x-axis) could be concentration, frequency of exposure, or length of exposure., The response (y-axis) could be anything from a sublethal outcome such as a headache to outright death.

Rachel Carson holding her ecotoxicological treatise Silent Spring. Image: Rachel Carson Archives
The Dose-Response Curve remained more or less tightly grounded in human (and domestic animal) toxicology for several decades more until Rachel Carson’s landmark 1962 treatise Silent Spring. That book served as a clarion call for exploring the effect of poisons on non-human elements of our biosphere and the potential wide-ranging effects on entire ecosystems that can emanate from the poisoning of a single population.
By 1970, the French toxicologist Dr. René Truhaut had coined the term ecotoxicology. Truhaut defined ecotoxicology as.
The branch of toxicology concerned with the study of toxic effects, caused by natural or synthetic pollutants, to the constituents of ecosystems, animal (including human), vegetable and microbial, in an integral context.
Soon ecotoxicology programs began springing up across universities worldwide. I could go on for pages about the rapid evolution of ecotoxicology since 1970 (the discovery of endocrine disruptors, modern whole-system ecotoxicology, etc.) but that is the subject for a future discussion…
The toxic components of crude oil
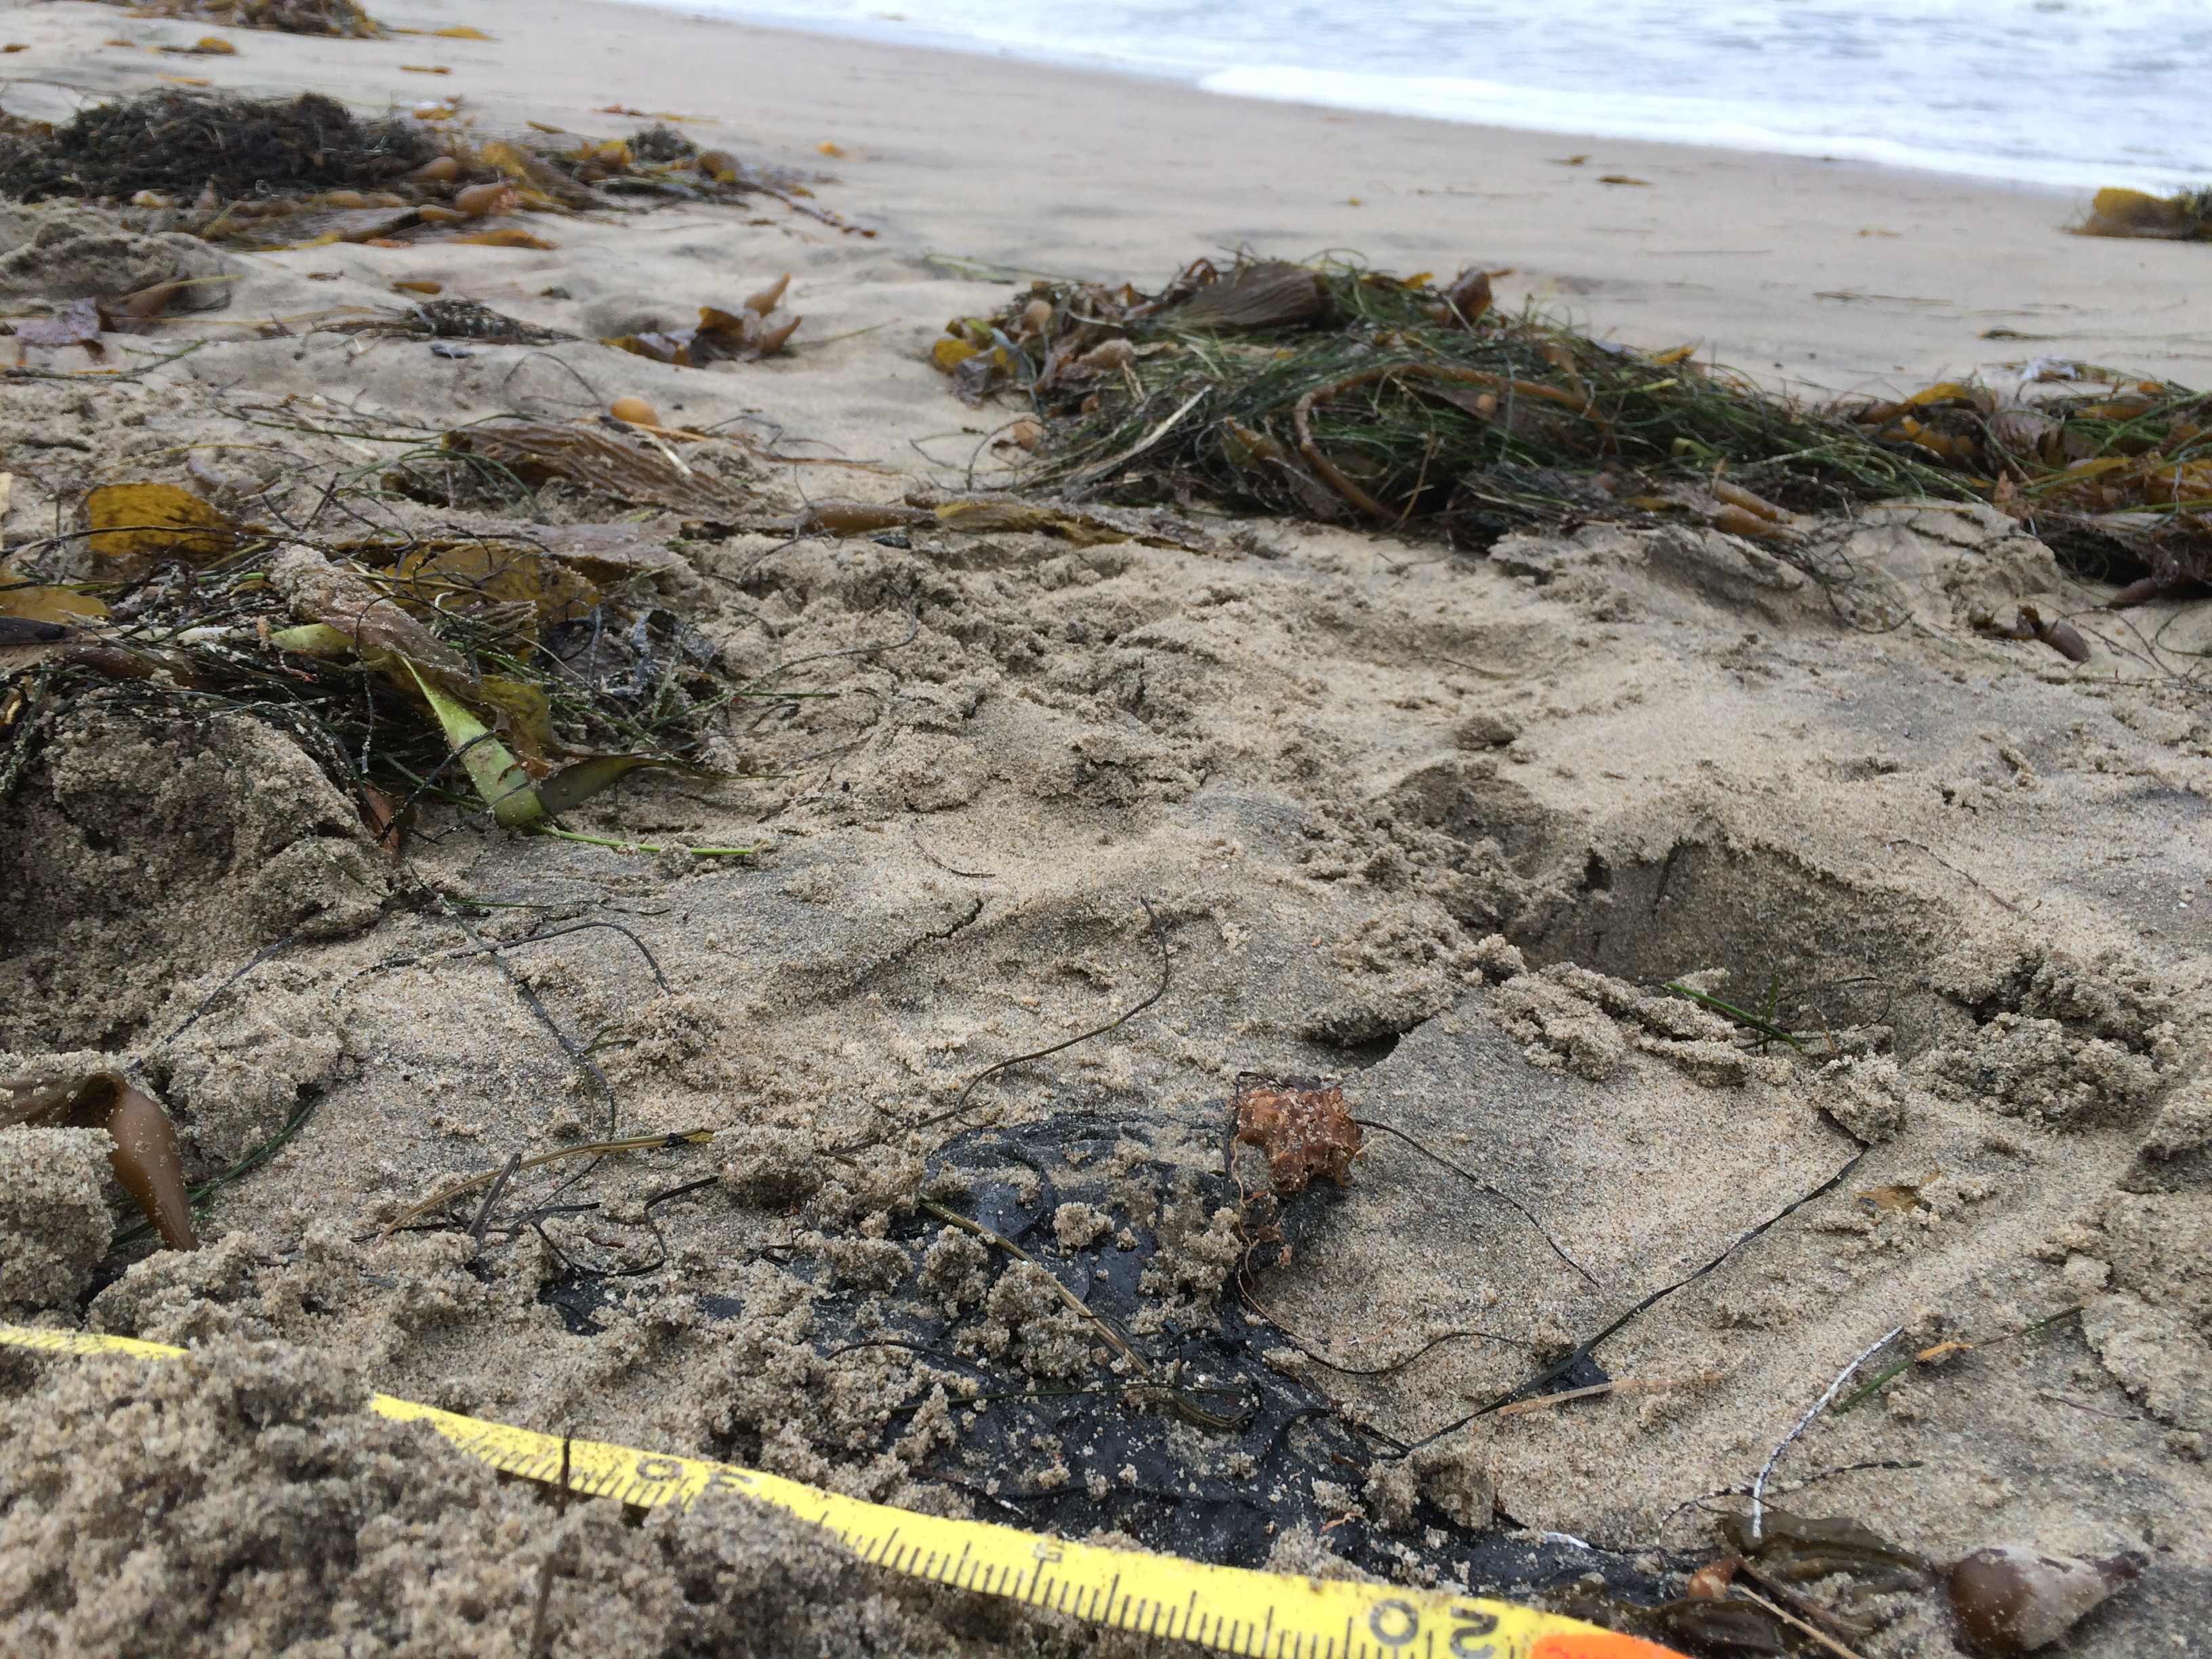
Large tar ball just deposited at El Matador State Beach. June 9, 2015.
Crude oil is a complex mixture of dozens and dozens of compounds. We typically think of the diverse array of hydrocarbons that comprise the “oil” itself, but there can be tons of other things hitching a ride and mixed up in the chemical soup that was hanging out underground for millions of years. These tagalongs include heavy metals, sulfur, etc. and have their own toxic responses. But for now, let’s stick to the basic hydrocarbon components as the variety of chemical structures in there is enough to boggle the mind.
As an aside: In graduate school we used to teach up-and-coming ecotoxicologists about toxicity via a series of labs exploring creosote. Creosote is the tarry substance that we historically impregnated wood with when we wanted a given post or beam to survive the ravages of structure-damaging organisms (boring worms that attack pier pilings, woodpeckers that attack telephone poles, etc.). That stuff was always crazy toxic and often sparked long discussions about the rainbow of potential poisonous compounds within the creosote that might be responsible for the toxicity we were observing in our instructional, classroom experiments. But we always ended up coming back to those good ol’ hydrocarbons when push came to shove. Those hydrocarbons are some amazingly lethal substances, especially when mixed with sunlight. But back to the the focus of this post…

Representations of Benzene. Image: Matthias M., CC BY-SA 3.0
The hydrocarbons in crude oil generally come in one of two flavors: alkanes and aromatics. Alkanes are the less poisonous of the two and are relatively quickly degraded in the environment by the local microbial community or strong sunlight/UV radiation. Aromatics (molecules centered around 6-carbon rings) could be described as the problem child of the crude oil family. Aromatics are generally the most toxic fraction of the crude. The majority of research into the aromatic fraction of oil has centered around the most problematic of these problem children; polycyclic aromatic hydrocarbons (PAHs), molecules with multiple carbon rings. PAHs have the ability to hang around for a comparatively long time in water and soils (what ecotoxicologists refer to as environmental persistence) as well as within the bodies of critters exposed to crude oil (especially in their fat).

Examples of the structure of the BTEX hydrocarbons in crude oil. Image source: Wikipedia
The most abundant and well-characterized crude oil PAHs are the so-called “BTEX” molecules: Benzene, Toluene, Ethylbenzene and Xylenes. Of these, Benzene is the most abundant and best understood. It is often present in concentrations as high 4 g/l in crude oil and can be at levels close to 1 ppb in seawater near oil or gas seeps (IPCS 1993). Non-petroleum, natural sources of BTEX include volcanic emissions and forest fires. We also love to use this solvent (and the other BTEX compounds) in industrial contexts across the globe.
Those Poisonous PAHs
Acute toxicity (short term exposure; minutes but usually hours to days) from the BTEX PAHs is well documented upon a wide variety of aquatic critters. In moderate concentrations, these PAHs can kill things pretty quickly, especially if we are talking about water-dwelling invertebrates (particularly when that water is stratified or relatively confined) or animals breathing in air rich with PAH vapors (such as we found on PCH in the immediate vicinity of the pipeline break on May 19). Short of killing you, breathing in a comparatively low concentration of these things can induce dizziness, euphoria (this is why teenagers sometimes huff gasoline fumes), nausea, blurry vision and headaches. Several of us who visited and/or drove past the Refugio spill site on May 20 experienced a rapid (within minutes) onset of headaches and nausea, most likely due to these unusually high concentration of these aromatic compounds in the air.
Chronic toxicity (long term exposure; weeks to years) from BTEX PAHs include damage to the liver, kidneys, heart, lungs, and nervous system of vertebrates. Impacts span cancer, developmental problems, reproductive failure, endocrine disruption, and even genotoxicity (the screwing up of your genetic code). Suffice it to say, this is all bad. Most of these effects have been characterized in model vertebrate systems (aka lab mice and estuary-dwelling fish). Mechanistic work on the toxicity of exposed invertebrates is getting better every year, but we still lack a good understanding of this for many species.
BTEX concentrations in the environment (after Leusch & Bartkow 2010)
Reported concentrations of benzene, toluene, ethylbenzene and xylene (BTEX) in air and water (in parts per billion). After Leusch & Bartkow 2010.
| Benzene | Toluene | Ethylbenzene | Xylenes | |
|---|---|---|---|---|
| Air (μg/m3) | ||||
| Remote rural area | 0.2 – 16 | 0.5 – 260 | 0.2 – 1.6 | <0.1 – 3 |
| Urban center, heavy traffic | Up to 349 | Up to 1,310 | Up to 360 | Up to 775 density |
| Water (ppb or μg/L) | ||||
| Surface water: clean | <0.1 – 2.1 | <1 – 15 | <0.1 – 1.8 | <0.1 – 1.2 |
| Surface water: contaminated | Up to 100 | unknown | Up to 15 | Up to 32 |
| Groundwater: clean | <0.1 – 1.8 | <1 ‐ 100 | <0.1 – 1.1 | <0.1 – 0.5 |
| Groundwater: contaminated | Up to 330 | Up to 3,500 | Up to 2,000 | Up to 1,340 |
| Drinking water | <0.1 – 5 | <1 – 27 | <1 ‐ 10 | <0.1 – 12 |
Tar’s Toxicity: our recent Refugio oil experiments
With that long-winded preamble, the big question everyone keeps asking us is:
Is all this tar washing up on our beaches toxic?
We are working on this as we speak, but our initial results are instructive. And the answer seems to be yes.
As I have discussed before, sandy beach-dwelling organisms are particularly at risk in this Refugio spill. My colleagues, students, and I are now supplementing our field surveys with laboratory experiments.
We have begun to explore the toxicity of the tar landing on our SoCal beaches with our model organism for this spill: the sand crab Emerita analoga.
We have found that both weathered and comparatively fresh tar landing on our local beaches both kills and screws with the normal activity of our sand crabs.

At this early stage, we can’t pinpoint the specific mechanism of toxicity. But this tar clearly has the potential to kill our sandy beach animals. We are working on estimates of how many might have been killed or been put at risk of being killed by this oiling of our beaches, but that will take some time. In the meantime, we can now say that these tar balls pitter-pattering upon our beaches from Santa Barbara to Orange County over these past few weeks are clearly toxic to our local sand crabs, the cornerstones of our sandy beach food web. This may not be the death knell to these populations, but it clearly was not a good thing for the ecology of our sandy beach ecosystem.

In other words, if you were a sand crab princess grumbling in a frustrating holding position as you impatiently waited for your turn to become the next queen, a little bit of strategically placed Refugio tar could easily hasten your ascent to the throne.