Unusual Metrics: Documenting our Workload
Not everything that counts can be counted, and not everything that can be counted counts. — Albert Einstein

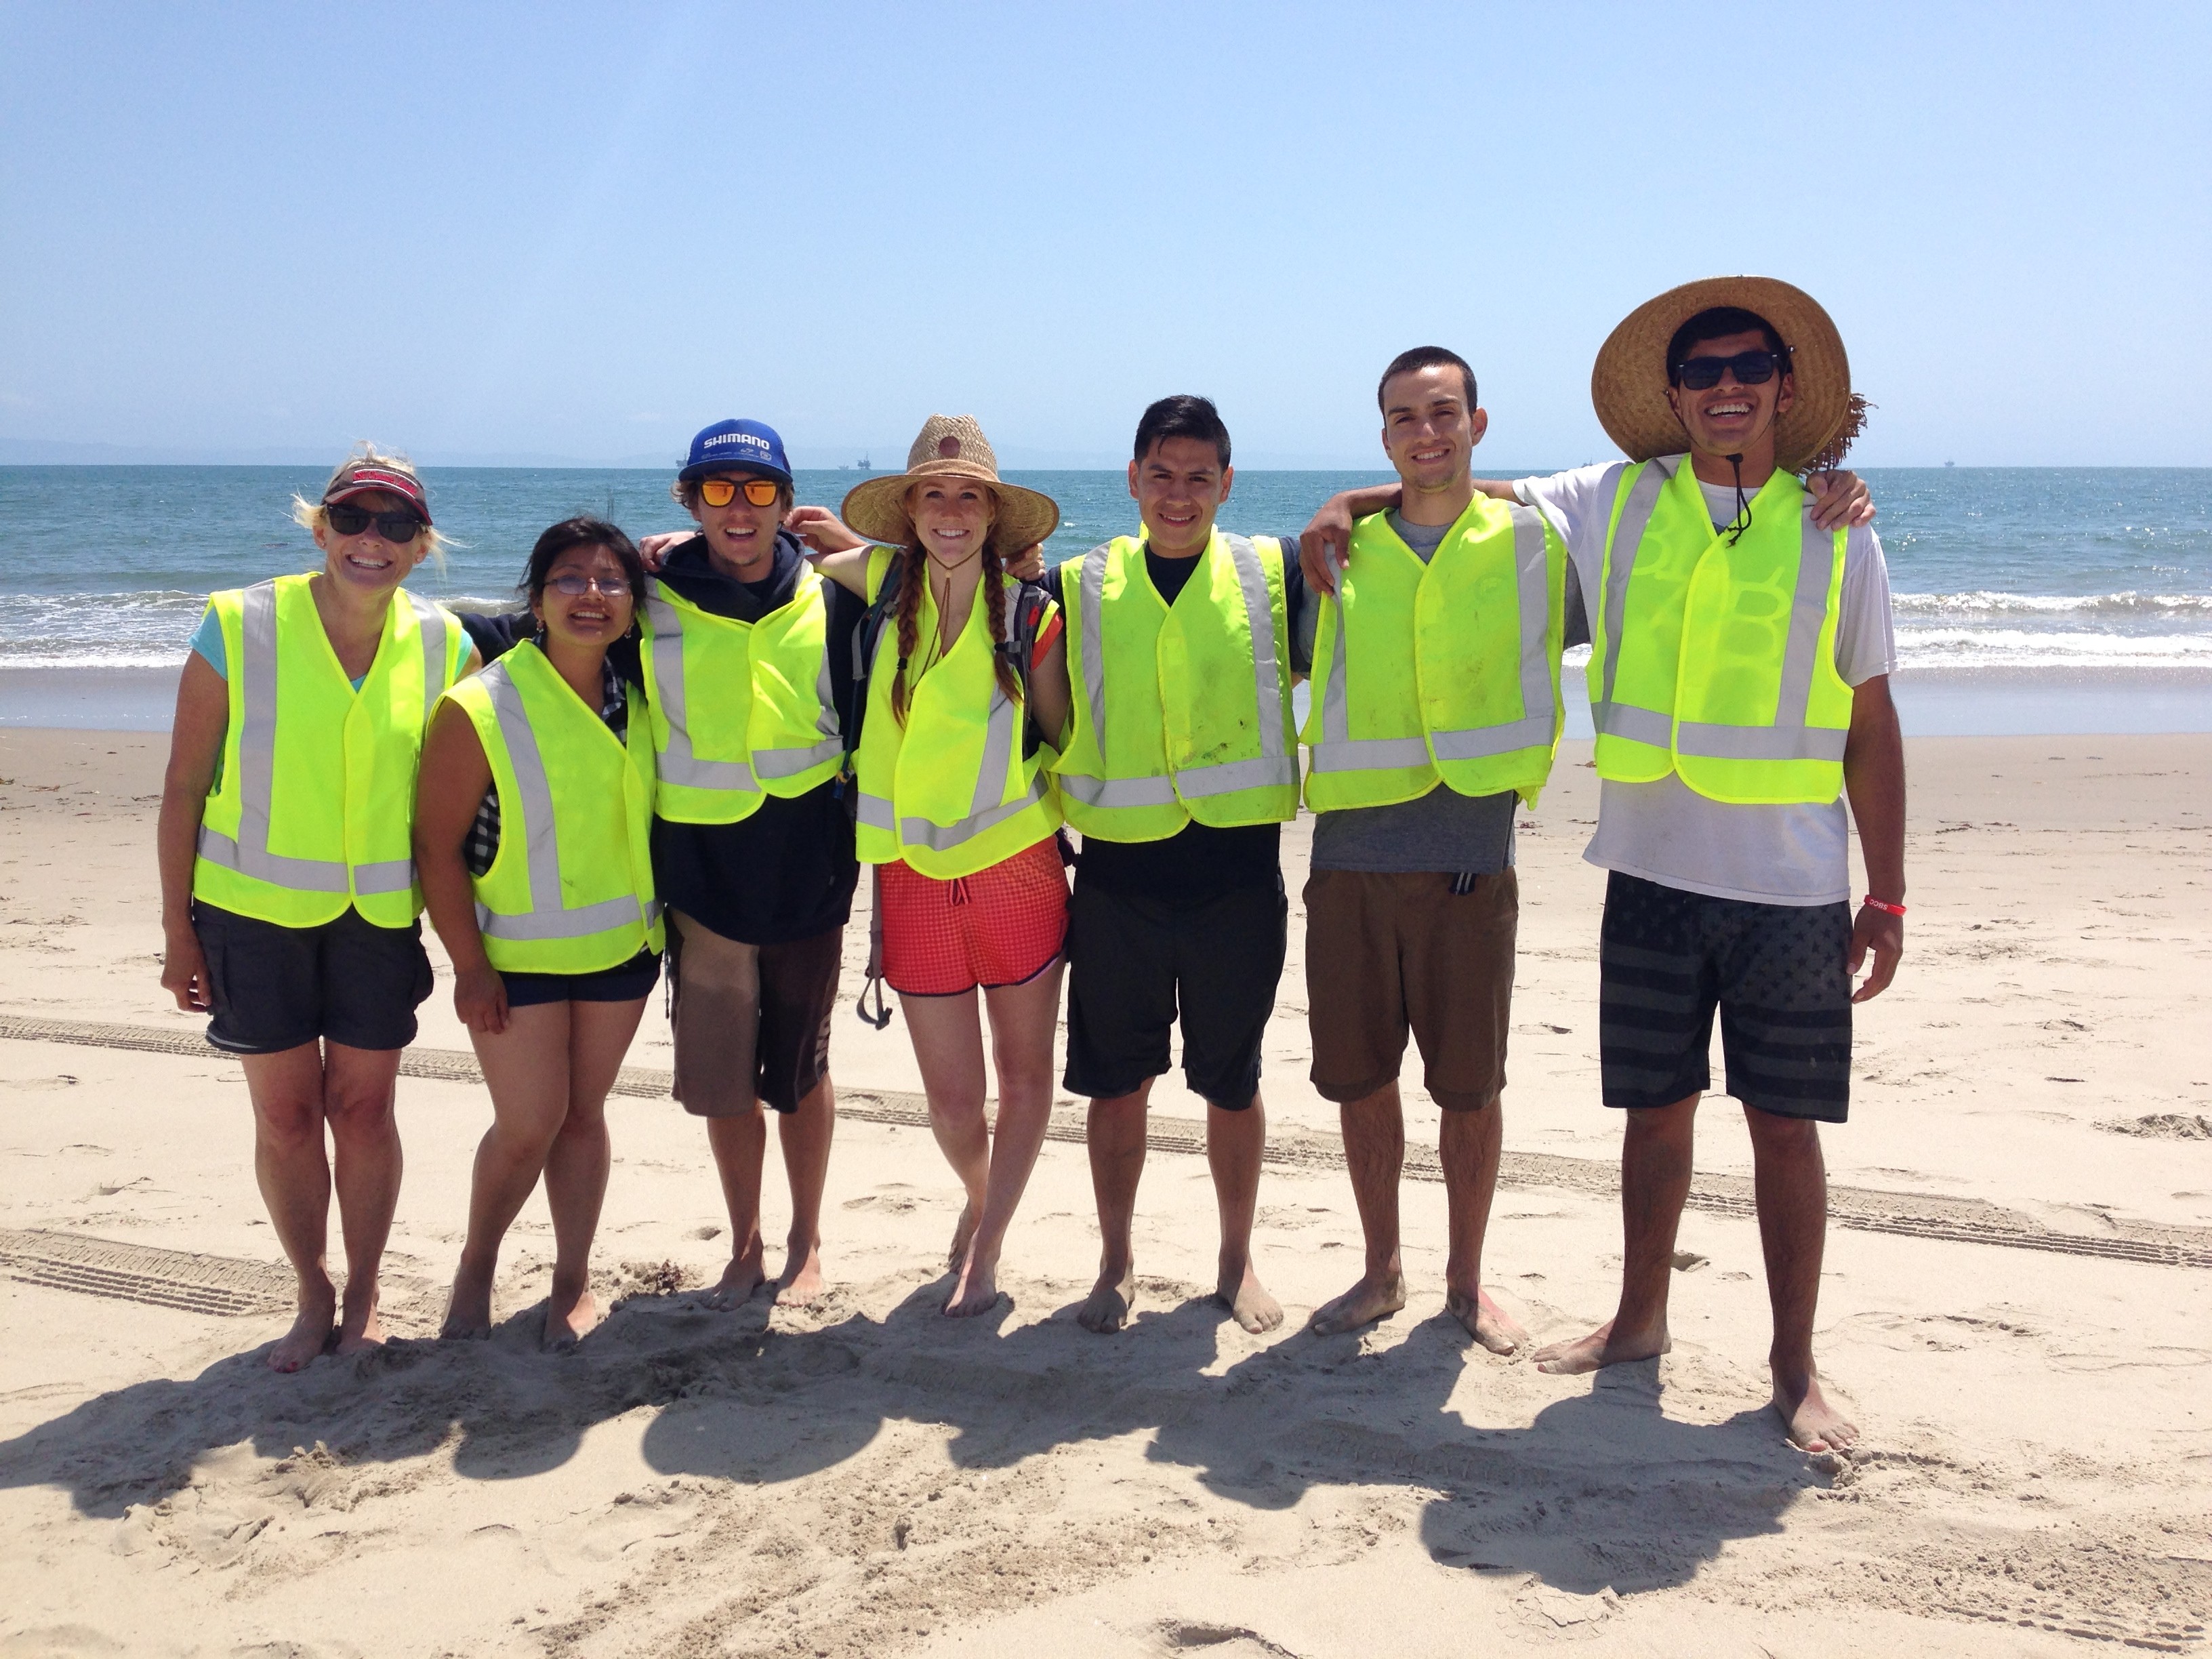
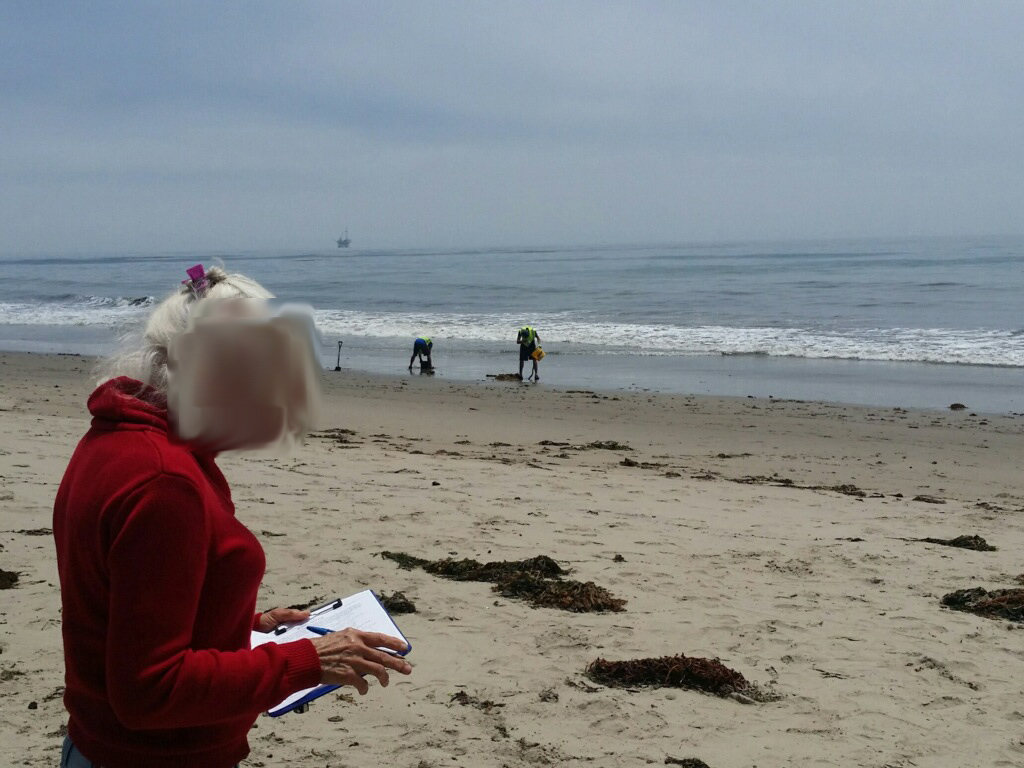
We have been fortunate to have been running a Summer Institute for undergraduates from CSU Channel Islands and our regional Community Colleges since 2009. Every June we pull in students from these campuses and embed them in intense academic research in a variety of disciplines. Most recently Project ACCESO, a program funded by a grant from the US Department of Education, has been the funder of this summer work. Our ESRM faculty have worked collaboratively to study beaches over the past three years. This year, we adapted some of our planned work to document and assess the oiling of many of our beaches. These 13 students were awesome and really stepped up to the plate.
When we talk about scientific work we frequently talk about the numbers of papers published in academic journals or the amount of grant money we are able to bring into our respective institutions. This is usually a “we rock, you suck” type endeavor with the good ol’ boys or good old ways of doing things begetting more good ol’ boys or the same old same old. But there are many, many more important metrics that are often hard to quantify. These are often intangibles or things for which we do not have a well-developed framework for assessing (although we could if we got serious about this). The ultimate goal for those of us working on training people to better conserve our natural resources centers around an amalgamation of:
- better understanding our planet’s interrelated systems
- translating that understanding into working knowledge within our students
- deepening the practical skill sets of the budding researchers (in this case, our undergraduates) who are/will be doing the work
- materially improving our planet’s condition
- (we might list a fourth essential component of getting gainful employment which utilizes all this skill and knowledge but that can take time to get)
We have just compiled a small set of such metrics for our Summer Institute work (for the three weeks it ran in June). They are fun to look over (if you are into these kinds of things).
| Category | Value | Metric |
| Environmental Variables | ||
| Stressors | 62 | dogs counted |
| 38 | off leash dogs | |
| 24 | on leash dogs | |
| 2,491 | cars counted parked at beach | |
| 326 | trash cans | |
| 5,131 | humans counted on the beach | |
| 2.8 | kg of tar collected from 0.25m 2 quadrats | |
| Organisms Encountered | 146 | grunions seen |
| 500 | grunion eggs found | |
| 12 | dead vertebrates (fish, birds, pinnipeds) found on beach | |
| 66 | crabs killed in EcoToxicology Experiments | |
| 3,332 | crabs measured | |
| 2,265 | birds counted | |
| 10,218 | infaunal invertebrates counted | |
| 3,488 | parasites encountered | |
| Sampling Logistics | ||
| Things Sampled | 49 | beaches assessed |
| 4 | Counties visited | |
| 78 | sand samples sieved for grain size | |
| 190 | infaunals transects | |
| 652 | datasheets filled out | |
| 5,358 | shovels/core scoops of sand | |
| 3,655 | quantiative cores of sand | |
| 1,703 | supplemental shovels to find crabs | |
| Opinion Polling | 210 | opinion polls conducted |
| 115 | people who were asked, but declined to take our opinion poll survey | |
| Transportation | 84 | gallons of gas used |
| 2,130 | miles driven (across all vehicles) | |
| 26 | km walked during quantiative bird surveys | |
| 2.45 | km 2 of beach surveyed intensely | |
| Equipment Damaged | 1 | clam guns lost |
| 3 | transect tapes compromised | |
| 23 | article of clothing lost to tarring | |
| Surviving Our Sampling | 74 | cups of coffee consumed |
| 512 | songs listened to | |
| 414 | metal songs | |
| 1 | parking tickets | |
| 14 | lbs of chips (primarily tortilla) consumed | |
| 12 | pieces of equipment needing de-oiling | |
| 8 | sand sifting screens destroyed by tar | |
| 25 | Sean’s random additional surveys | |
| Student Growth | ||
| 13 | Summer Institute Student Researchers | |
| 4 | Summer Institute Faculty | |
| 2,584 | person hours | |
| 1,768 | person field hours | |
| 52 | person hours in the field in the rain | |
| 816 | person lab hours | |
| 3 | weeks of work | |
| 121 | people asked our students what they were doing | |
| 38 | people thanked students for doing their work | |
| 59 | rejected hypotheses | |
| 1 | games created | |
| 1 | TV News stories featuring Summer Institute Students | |
| 7 | students presenting scientific data (in poster form) for the first time | |
| 6 | students speaking in public for the first time about science |