Posts

Accidents beget more accidents…especially in Deepwater

Here is an interesting poster from the Bureau of Safety and Environmental Enforcement (one of the daughter regulatory arms of the Interior Department birthed from the now dead Minerals Management Service in the wake of the Deepwater Horizon blowout).

BSEE analysts have used inspection and accident incident reports from 2011 through 2014 to show that (surprise, surprise) a dangerous work place last year is also a dangerous workplace this year.  Perhaps more interesting is the fact that our low-rig density region in the deeper offshore waters of the northern Gulf of Mexico have an aberrantly high number of accidents.


The red blobs in this figure are abnormally high frequencies of accident regions.  See this legend:

 +4SD is really, really high.

What can we take away from this?  Offshore drilling is dangerous to be sure.  But deep- and ultradeepwater drilling is manifestly different from the more common shallow water drilling efforts.  Regarless if this is due to the inherent logistical difficulties of such deep drilling, the greater complexity and coordination that must be manifest, the relative naïveté of the operators in this new frontier, or the increased pressure for results and profit that follow in the wake of the intense capital outlays that are required to play in these worlds, it all amounts to greater risk and a more dangerous oil extraction endeavor.

See a webpage about this BSEE data here.

Note: there are no authors listed on the poster, but the program attributed the work to Allison Fischman of BSEE.

Here is that overall poster:


This poster was presented at the ESRI Users Conference in San Diego on July 20, 2015.

Rare Bipartisanship on Oil Regulation

Wow!  I guess dreams really do come true.  At least when it comes to critiquing federal agencies in the wake of an oil spill.  And when the agency that has been understaff and under-resourced bears some of the blame for an oil spill, you bet that we can all get on board the you are to blame train.  As in it was you and not it was us (aka the folks who give you mandates without the funding to carry them through).

PHMSA Web Page 07-14-15

You can read about the all-too-rare-these-days bipartisan critique of the Pipeline and Hazardous Materials Safety Administration here.

The Ventura County Star‘s Kevin Freking and Michael Blood have a good piece on this unified front this afternoon:

An agency that oversees the safety of the nation’s pipelines has failed to follow through on congressional reforms that could have made a difference in a May break that created the largest coastal oil spill in California in 25 years, a House committee chairman said Tuesday.

In a rare display of agreement on Capitol Hill, Republicans and Democrats on the Energy and Power Subcommittee expressed frustration with inaction by the Pipeline and Hazardous Materials Safety Administration, which has yet to complete more than a dozen requirements outlined in a 2011 federal law.

Among the unfinished work was revising regulations to establish specific time periods for notification of authorities after an accident.

The owner of the California line, Plains All American Pipeline, has been criticized for taking about 90 minutes to alert federal responders after confirming the spill near Santa Barbara.

“Some of these provisions I am convinced would have made a difference in the recent oil spill in Santa Barbara had they been implemented in a timely manner,” said Rep. Fred Upton, a Michigan Republican who chairs the House Committee on Energy and Commerce.

Other incomplete requirements include issuing regulations on shut-off valves for new lines that can quickly stop the flow of gas or oil in an accident and regulations that would require leak detection systems on hazardous liquid pipelines and establish leak-detection standards, according to the committee.

The agency has completed 26 of 42 reforms from the 2011 law, but the California spill has given new urgency to questions about the agency’s effectiveness and its progress on the remaining 16 requirements…

…Records filed by Santa Barbara County indicate that firefighters who arrived at the scene just before noon on May 19 quickly recognized that some sort of leak or spill had occurred. Crude was gushing from a bluff like a fire hose “without a nozzle,” the records said.However, company employees at the scene did not confirm a leak until about 1:30 p.m., and it would be nearly 3 p.m. before the company would contact the response center. By then, the federal response led by the Coast Guard was underway.

At the hearing, Democratic Rep. Frank Pallone of New Jersey told the agency’s interim executive director, Stacy Cummings, that he was “deeply concerned about PMHSA’s ability to carry out its mission.”

Cummings said the agency was making progress on the remaining regulations, but she did not give lawmakers a detailed timeline for completion.

“We share your concern and sense of urgency,” she told lawmakers.

Cummings said the pipeline near Santa Barbara will remain shut until the cause of the break is determined and any other risks are fixed, and that any lessons from the spill will be incorporated into policies to prevent future accidents.

New federal funding should allow the agency to boost staffing for safety inspections and accident investigations, she said.

“We are committed to quadrupling our efforts so that Americans can be confident that PHMSA is protecting people and the environment,” Cummings said.

If you are curious as to the PHMSA’s arguments to congress, those are not yet posted on their website (only testimony up through 2014 is posted…I guess we call that budget cuts again?) so good luck on that front.  Same goes for the Congressional Subcommittee doing all this critiquing: no recent records on the testimony or situation in Santa Barbara County.  But I suspect those comments will be up shortly here.

KVTA July 7 Interview

KVTA Morning Show pic

This past Monday, I returned to the KVTA Morning show with Tom Spence and Rich Gualano to discuss the past month in our Refugio Oil Spill saga.  We discuss the evidence that pipeline oil spanned at least three counties, the problem with a lack of access in the early part of the spill timeline, and the impacts to ecosystem elements.


Unusual Metrics: Documenting our Workload

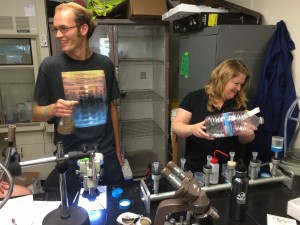
Dissected sand crabs in the PIRatE Lab

Not everything that counts can be counted, and not everything that can be counted counts. — Albert Einstein


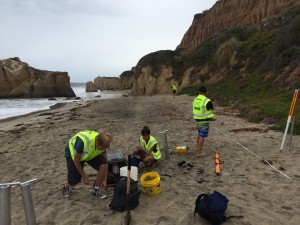
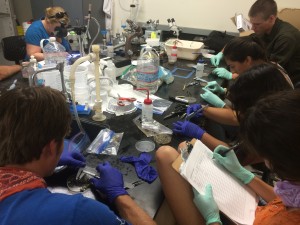
We have been fortunate to have been running a Summer Institute for undergraduates from CSU Channel Islands and our regional Community Colleges since 2009.  Every June we pull in students from these campuses and embed them in intense academic research in a variety of disciplines.  Most recently Project ACCESO, a program funded by a grant from the US Department of Education, has been the funder of this summer work.  Our ESRM faculty have worked collaboratively to study beaches over the past three years.  This year, we adapted some of our planned work to document and assess the oiling of many of our beaches.  These 13 students were awesome and really stepped up to the plate.

When we talk about scientific work we frequently talk about the numbers of papers published in academic journals or the amount of grant money we are able to bring into our respective institutions.  This is usually a “we rock, you suck” type endeavor with the good ol’ boys or good old ways of doing things begetting more good ol’ boys or the same old same old. But there are many, many more important metrics that are often hard to quantify.  These are often intangibles or things for which we do not have a well-developed framework for assessing (although we could if we got serious about this).  The ultimate goal for those of us working on training people to better conserve our natural resources centers around an amalgamation of:

  1. better understanding our planet’s interrelated systems
  2. translating that understanding into working knowledge within our students
  3. deepening the practical skill sets of the budding researchers (in this case, our undergraduates) who are/will be doing the work
  4. materially improving our planet’s condition
  5. (we might list a fourth essential component of getting gainful employment which utilizes all this skill and knowledge but that can take time to get)

We have just compiled a small set of such metrics for our Summer Institute work (for the three weeks it ran in June).  They are fun to look over (if you are into these kinds of things).

Category Value Metric
Environmental Variables
Stressors 62 dogs counted
38 off leash dogs
24 on leash dogs
2,491 cars counted parked at beach
326 trash cans
5,131 humans counted on the beach
2.8 kg of tar collected from 0.25m 2 quadrats
Organisms Encountered 146 grunions seen
500 grunion eggs found
12 dead vertebrates (fish, birds, pinnipeds) found on beach
66 crabs killed in EcoToxicology Experiments
3,332 crabs measured
2,265 birds counted
10,218 infaunal invertebrates counted
3,488 parasites encountered
Sampling Logistics
Things Sampled 49 beaches assessed
4 Counties visited
78 sand samples sieved for grain size
190 infaunals transects
652 datasheets filled out
5,358 shovels/core scoops of sand
3,655 quantiative cores of sand
1,703 supplemental shovels to find crabs
Opinion Polling 210 opinion polls conducted
115 people who were asked, but declined to take our opinion poll survey
Transportation 84 gallons of gas used
2,130 miles driven (across all vehicles)
26 km walked during quantiative bird surveys
2.45 km 2 of beach surveyed intensely
Equipment Damaged 1 clam guns lost
3 transect tapes compromised
23 article of clothing lost to tarring
Surviving Our Sampling 74 cups of coffee consumed
512 songs listened to
414 metal songs
1 parking tickets
14 lbs of chips (primarily tortilla) consumed
12 pieces of equipment needing de-oiling
8 sand sifting screens destroyed by tar
25 Sean’s random additional surveys
Student Growth
13 Summer Institute Student Researchers
4 Summer Institute Faculty
2,584 person hours
1,768 person field hours
52 person hours in the field in the rain
816 person lab hours
3 weeks of work
121 people asked our students what they were doing
38 people thanked students for doing their work
59 rejected hypotheses
1 games created
1 TV News stories featuring Summer Institute Students
7 students presenting scientific data (in poster form) for the first time
6 students speaking in public for the first time about science


Summer Research Institute Carpinteria North Team 2015 06 05

Naples Reef Still Looking Good


KEYT Coverage of Coastkeeper Naples SCUBA Trip July 2015 d

Santa Barbara Channelkeeper’s Ben Pitterle talking to KEYT on July 6, 2015.

Our colleagues at Santa Barbara Channelkeeper just ran another subtidal inspection on Naples Reef (a few minutes south of the Refugio spill epicenter) and happily again found no obvious sign of major oiling in the area.  This combined with our previous surveys in this same area a few weeks back and California Reef Check‘s surveys off of Refugio last week imply that we avoided any massive subtidal oil deposition.  That is awesome, but we still need to conduct quantitative surveys of the areas most likely to accumulate oil (something prevented by the closure still in effect).

See the KEYT coverage of the most recent inspection by clicking the image below and clicking through to the embedded video:

KEYT Coverage of Coastkeeper Naples SCUBA Trip July 2015 b

Other good news:

Anyone wanting to get out to Naples Reef post-spill now has an easy way to do so.  The Santa Barbara Channelkeepers are offering a discounted dive trip to the area tomorrow.  If anyone is interested is seeing the reef that lies about a mile offshore, head to Channelkeepers website to sign up.  Last word from Ben, was that there was still space on tomorrow’s trip!


Deepwater Horizon: The Settlement

Deepwater Horizon rig on fire the day after the rig blew out, April 21, 2010.  Image: U.S. Coast Guard.

Deepwater Horizon rig on fire the day after the rig blew out, April 21, 2010. Image: U.S. Coast Guard.

Is a bird in the hand worth two in the bush? Apparently government and industry lawyers both think so.

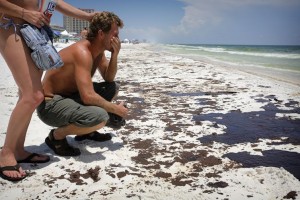
Beach goers react to oiling of northern Florida beaches in the summer of 2010.  Image: Tampa Bay Times.

Beach goers react to oiling of northern Florida beaches in the summer of 2010. Image: Tampa Bay Times.

I’m eating some squid nigiri and a baked crawfish California roll at my favorite sushi spot in Thousand Oaks to celebrate the end to this five-year escapade and pen this here blog entry. But enough about Tomodachi…back to the lawsuit.

This morning the final settlement for environmental impact-related lawsuits related to the 2010 Deepwater Horizon Blowout (aka the Gulf Oil Spill,  aka the BP Oil Spill) was announced. British Petroleum agreed to pay $18.7 billion to settle a range of federal, state and local governmental claims stemming from their failed April 2010 effort to cement in/cap the successful exploratory well drilled 1,500 m below the surface of the ocean and 75 km (47 mi) off the Louisiana coastline. The ensuing three month-long “spill” (it was technically a blowout, but everyone calls it a spill and so I will adopt that de facto lingo from here on out) was the largest marine oil spill in U.S. history and second largest overall oil spill in U.S. history (the largest being the Lakeview Gusher that blewout on land 100 years prior to the Deepwater Horizon in southcentral California; go check out the admission-free Western Kern Oil Museum to learn more, only about 90 minutes from Camarillo).

As with so many things these days, I am of two minds when it comes to this settlement. The reality is that it will not make us whole relative to the impacts incurred from the 2010 spill. But I also know that our legal system is not up to the task of making us whole. The entire premise of an adversarial arena to settle technical questions is, quite frankly, a joke. But human nature being what it is, this is the system we are stuck with and the convention we have at hand. Given the litigious context in which we live, this was probably the best we could hope for as far as rapidly recovering funds to repair the environmental damage incurred across the northern Gulf of Mexico.

Louisiana Attorney General Buddy Caldwell announced Thursday morning that BP has reached an agreement with U.S. authorities on an $18.7 billion settlement in the 2010 Deepwater Horizon disaster in the Gulf of Mexico.  Photo: Mark Ballard, Louisiana Advocate.

Louisiana Attorney General Buddy Caldwell announced Thursday morning that BP has reached an agreement with U.S. authorities on an $18.7 billion settlement in the 2010 Deepwater Horizon disaster in the Gulf of Mexico. Photo: Mark Ballard, Louisiana Advocate.

Properly interpreting the BP settlement

Step 1: The Reality

Lets begin with a clear statement of impact: The Louisiana coastal, offshore, and deep benthic regions bore the brunt of the ecological impacts from the Deepwater Horizon spill.

Step 2: Everyone Wants a Piece

As soon as oil starts erupting from the containment vessel or pipe, people start sticking their hands out. In the case of the Deepwater Horizon, every Gulf State ran to the front of the line with both hands out saying “What about me?” Leave out the fact that most of these governments have actively sought to limit regulatory oversight of the oil and gas industry and to properly mitigate for the impacts stemming from their own anti-wetland/anti-coastline policies (completely separate from oil or gas). Since the first week of May 2010, everything from the federal RESTOR act to the GOMRI has emphasized that money needs to flow to all of these Gulf States before anyone/anywhere else. So Texas and Florida get their slice even though any impacts to those areas from Deepwater Horizon oil were minimal at best. That translates into less for Louisiana’s environment.

Another large chunk of funds from this settlement will go to compensate for knock-on economic impacts of the spill such as shuttered oyster houses, hoteliers who experienced cancelled reservations, etc. That also translates into less for Louisiana’s environment.

Add to the all this the fact that the northern Gulf of Mexico was the most poorly studied and monitored region of the United States prior to the 2010 disaster. This was the only region of the United States without a Long-Term Ecological Research site (funded by the NSF), the location with the poorest array of littoral monitoring sites (ala our MARINe network here in California), etc. This all has made our estimating of the true magnitude of impacts from the spill difficult; if you fell off of edge of fog-shrouded cliff, you are hard pressed to know if you are perched 10 or 100 or 1,000 feet from the safety of the cliff-top trail.

Step 3: The Settlement By the Numbers:

Overall BP Payout: $18.7 billion

  • $7.1 billion (over 15 years) for mitigating impacts documented by the Natural Resources Damage Assessment (NRDA; a federal effort governed by the Oil Pollution Act of 1990). Note that BP will claim they are spending $8.1 billion. In reality they will only be expending $7.1 from here forward as they are to be given credit for the nearly $1 billion they have spent to date on NRDA-related recovery projects prior to July 2010.
  • $5.5 billion (over 15 years) for civil penalties dictated by the Clean Water Act. Note that much of this is a formulaic, dictated by how much oil (I think they have ignored the gas emissions) was released. This was also the reason BP was so strenuously challenging the world’s best estimate of the real amount of oil that was released from the wellhead (from the Joint Flow Rate Technical Group), ultimately getting Judge Barbier estimate of oil released lowered from the actual value of 4.19 million barrels to 3.19 million barrels.
  • $4.9 billion (over 18 years) for economic claims.
  • $232 million will be slated to cover any further damages not documented as of this morning. From their accounting tables, it looks like this will be held in reserve until the 18th year unless there is a credible argument put forth to access this sooner.
  • <$1 billion to resolve claims from more than 400 local governments.

Texas: $388 million

  • $238 million for NRDA (no Clean Water Act violation penalties were articulated).
  • $150 million for economic damages.

Louisiana: $6.8 billion

  • $5 billion for NRDA.
  • $787 million in Clean Water Act penalties.
  • $1 billion for economic impacts

This settlement will bring Louisiana’s total funding from BP for the Deepwater Horizon disaster to around $10 billion, more than any of the other Gulf state.  Reacting to the settlement announcement, Louisiana Governor Bobby Jindal noted “these funds will allow us to build on the momentum gained through the state’s increased investment in coastal protection and restoration since 2008.”  And if you believe Louisiana has seriously invested large sums in coastal restoration since 2008 or that Governor Jindal’s administration is even vaguely interested or capable of effectively launching such an investment, then I have a bridge to sell you…

Mississippi: $1.5 billion

  • $183 million for NRDA
  • $582 million for Clean Water Act penalties.
  • $750 million for economic damage

Alabama: $1.3 billion

  • $296 million for NRDA (no Clean Water Act violation penalties were articulated).
  • $1 billion for economic damages

Florida: $3.25 billion

  • $1.25 billion for NRDA and Clean Water Act violations (no press release has adequately distinguished these two categories sufficiently for me break these down further).
  • $2 billion for its economic loss claims.

Environmental protection for Governor of Florida Rick Scott has historically been a very low priority.  His historic actions imply his interest in the environment is limited.  As long as something looks aesthetically pleasing, that appears to be good for this public servant.  He was happy to note that this money will help “keep our state beautiful.” Good luck with that one.

BP: Mostly Upsides

This year has mostly been about upsides for BP.  In addition to their successfully getting the estimate of oil released lowered, they company will be paying $7 billion less than it estimated it might have to pay for ecological impacts.  In addition, all of the NRDA payments are classified as compensatory (unlike the Clean Water Act payments) and so tax deductible.  Can anyone say “flat tax?” Keep in mind as well that all of these payments will take place over 15 or 18 years.

In case you were wondering, BP reported gross profits (not gross revenue) of $4.13 billion in for the first three months of 2015 alone.  For post blowout period (2011-2014), BP has reported gross profits of $199.85 billion.  The settlement is 9.4% of that amount.  Lots of money to be sure, but a minor bump all things considered. Investors agree with BP shares closing today up 4.7%.

Step 4: Putting that money to work

Given the paucity of pre-2010 data across the region and sheer technical difficulties of restoring pelagic or abyssal communities, most of this NRDA and Clean Water Act will be directed to coastal areas where we have much more experience and a more or less proven track record of recovering ecological functioning.  Most states have articulated their desire to spend these monies on restoring coastal bottomland hardwood forests, marsh, oyster beds, sea grass beds, etc.  And so now the political gamesmanship will kick into high gear.  Everyone and their brother will be arguing that their project really needs this money.  And given the fact that not all restoration projects cost the same (see a classic example for the varying costs for restoring different types of wetlands, which I have adjusted to 2015 dollars), coastal resource managers will find themselves very popular over the coming months and years.  Don’t worry about political interference from state capitols. That never, ever, ever happens in Louisiana.

CWPPRA Project List

Project Name Lead Agency Project Types Parishes Current Estimate Net Acres Benefited
TOTAL 2283862836.83 101106
No Name Bayou Marsh Creation NMFS Marsh Creation Cameron 28253136 497
Shell Beach South Marsh Creation EPA Marsh Creation St. Bernard 28101518 344
New Orleans Landbridge Shoreline Stablization USFWS Marsh Creation Orleans 17549317 167
West Fourchon Marsh Creation & Nourishment NMFS Marsh Creation Lafourche 29405764 304
Caminada Headlands Back Barrier Marsh Creation EPA Marsh Creation Lafourche 31034094 181
Bayou Grande Cheniere Marsh & Ridge Restoration USFWS Marsh Creation Plaquemines 29104945 264
South Grand Chenier Marsh Creation – Baker Tract NRCS Marsh Creation Cameron 25441833 393
Island Road Marsh Creation & Nourishment NMFS Marsh Creation Terrebonne 39185267 312
Bayou Dupont Sediment Delivery EPA Marsh Creation Jefferson, Plaquemines 38279163 383
Terracing & Marsh Creation South of Big Mar USFWS Marsh Creation, Terracing Plaquemines 23692705 303
Cameron Meadows Marsh Creation and Terracing NMFS Marsh Creation, Terracing Cameron 27685820 264
North Catfish Lake Marsh Creation NRCS Marsh Creation Lafourche 30385887 401
Northwest Turtle Bay Marsh Creation USFWS Marsh Creation Jefferson 23198757 407
Oyster Bayou Marsh Creation and Terracing NMFS Marsh Creation, Terracing Cameron 29781355 433
LaBranche Central Marsh Creation NRCS Marsh Creation St. Charles 42159208 731
Cole’s Bayou Marsh Restoration NMFS Marsh Creation, Hydrologic Restoration Vermilion 26631224 398
Kelso Bayou Marsh Creation NRCS Marsh Creation Cameron 16632765 274
Cameron-Creole Watershed Grand Bayou Marsh Creation USFWS Marsh Creation Cameron 23405612 476
Coastwide Vegetative Planting NRCS Vegetative Planting 12689725 779
Bayou Bonfouca Marsh Creation USFWS Marsh Creation St. Tammany 23875866 478
Terrebonne Bay Marsh Creation-Nourishment USFWS Marsh Creation Terrebonne 27414401 353
Cheniere Ronquille Barrier Island Restoration NMFS Barrier Island Restoration Plaquemines 43828285 308
Freshwater Bayou Marsh Creation NRCS Marsh Creation Vermilion 25523755 279
LaBranche East Marsh Creation NRCS Marsh Creation St. Charles 32323291 715
Lost Lake Marsh Creation and Hydrologic Restoration USFWS Marsh Creation Terrebonne 34626728 452
Grand Liard Marsh and Ridge Restoration NMFS Marsh Creation Plaquemines 42579616 370
Bertrandville Siphon (Deauthorized) EPA Freshwater Diversion Plaquemines 22578278 1613
Cameron-Creole Freshwater Introduction NRCS Freshwater Diversion Cameron 12787044 473
Non-Rock Alternatives to Shoreline Protection Demonstration NRCS Demonstration 6108699 0
Central Terrebonne Freshwater Enhancement NRCS Hydrologic Restoration Terrebonne 16640120 233
West Pointe a la Hache Marsh Creation NRCS Marsh Creation Plaquemines 16136639 203
Bayou Dupont Marsh and Ridge Creation NMFS Marsh Creation Jefferson 38539615 186
South Lake Lery Shoreline and Marsh Restoration USFWS Outfall Management 32466987 409
Bio-Engineered Oyster Reef Demonstration NMFS Demonstration 2291276.22 0
Sediment Containment System for Marsh Creation Demonstration NRCS Demonstration 1163343 0
Alligator Bend Marsh Restoration and Shoreline Protection (Inactive) NRCS Marsh Creation Orleans 29891722 181
Madison Bay Marsh Creation and Terracing NMFS Marsh Creation Terrebonne 38798788 334
West Belle Pass Barrier Headland Restoration NMFS Marsh Creation, Barrier Headland Lafourche 42250417 305
Enhancement of Barrier Island Vegetation Demonstration EPA Demonstration, Vegetative Planting 919599 0
Lake Hermitage Marsh Creation USFWS Marsh Creation Plaquemines 38300898 447
Venice Ponds Marsh Creation and Crevasses (Inactive) EPA Marsh Creation, Water Diversion Plaquemines 1074522 318
South Shore of the Pen Shoreline Protection and Marsh Creation NRCS Shoreline Protection Jefferson 21639574 106
East Marsh Island Marsh Creation EPA Marsh Creation Iberia 23025451 169
Shoreline Protection Foundation Improvements Demonstration COE Demonstration, Shoreline Stabilization Vermilion 1055000 0
Goose Point/Point Platte Marsh Creation USFWS Marsh Creation St. Tammany 14558123.48 436
Whiskey Island Back Barrier Marsh Creation EPA Barrier Island Restoration, Marsh Creation Terrebonne 30414086 272
Bayou Dupont Sediment Delivery System EPA Marsh Creation, Dredged Material Jefferson, Plaquemines 27702940.56 326
Floating Marsh Creation Demonstration NRCS Marsh Creation, Demonstration Jefferson, Lafourche, Plaquemines, St. Charles, St. Mary, Terrebonne, St. John the Baptist 1080891 0
South White Lake Shoreline Protection COE Shoreline Protection Vermilion 14466980.83 844
Barataria Basin Landbridge Shoreline Protection, Phase 4 NRCS Shoreline Protection Jefferson 17709216.57 256
Pass Chaland to Grand Bayou Pass Barrier Shoreline Restoration NMFS Barrier Island Restoration Plaquemines 40710723.33 263
Dedicated Dredging on the Barataria Basin Landbridge USFWS Marsh Creation Jefferson 16286153 242
Little Lake Shoreline Protection/ Dedicated Dredging Near Round Lake NMFS Marsh Creation, Shoreline Protection Lafourche 29442353.14 713
Barataria Barrier Island Complex Project: Pelican Island & Pass La Mer NMFS Barrier Island Restoration Plaquemines 77290188 334
Holly Beach Sand Management NRCS Shoreline Protection Cameron 14130232.86 330
Coastwide Nutria Control Program NRCS Herbivory Control Ascension, Calcasieu, Cameron, Iberia, Jefferson, Lafourche, Orleans, Plaquemines, St. Bernard, St. Charles, St. Mary, St. Tammany, Terrebonne, Vermilion, St. James, St. John the Baptist, St. Martin, Assumption, Jefferson Davis, Acadia, Lafayette, West Baton Rouge, East Baton Rouge, Iberville, Livingston, Tangipahoa 68040614.41 14963
South Grand Chenier Marsh Creation USFWS Hydrologic Restoration Cameron 22623346 414
Grand Lake Shoreline Protection NRCS Shoreline Protection Cameron 10055616 45
West Lake Boudreaux Shoreline Protection and Marsh Creation USFWS Marsh Creation, Shoreline Protection Terrebonne 19449961.1 277
Ship Shoal: Whiskey West Flank Restoration (Inactive) EPA Barrier Island Restoration Terrebonne 3742053 195
Raccoon Island Shoreline Protection/Marsh Creation NRCS Marsh Creation, Shoreline Protection Terrebonne 20114792 71
Hydrologic Restoration and Vegetative Planting in the des Allemands Swamp EPA Freshwater Diversion St. James 8263731 941
Delta Management at Fort St. Philip USFWS Sediment and Nutrient Trapping, Outfall Management Plaquemines 2739727.47 267
East Sabine Lake Hydrologic Restoration USFWS Hydrologic Restoration Cameron 6049989.79 225
Rockefeller Refuge Gulf Shoreline Stabilization NMFS Shoreline Protection Cameron 28082507 256
Grand-White Lakes Landbridge Protection USFWS Shoreline Protection Cameron 8584333.73 213
Lake Borgne Shoreline Protection EPA Shoreline Protection St. Bernard 27520807.84 165
GIWW Bank Restoration of Critical Areas in Terrebonne NRCS Shoreline Protection Terrebonne 13022246 64
North Lake Mechant Landbridge Restoration USFWS Marsh Creation, Vegetative Planting, Dredged Material Terrebonne 36734873 604
Terrebonne Bay Shore Protection Demonstration USFWS Demonstration, Shoreline Protection Terrebonne 2718818.22 0
Barataria Basin Landbridge Shoreline Protection, Phase 3 NRCS Shoreline Protection Jefferson 46231597 264
Black Bayou Culverts Hydrologic Restoration NRCS Hydrologic Restoration Cameron 16399059 540
GIWW – Perry Ridge West Bank Stabilization NRCS Shoreline Protection Calcasieu 2204708.74 83
Freshwater Introduction South of Highway 82 USFWS Hydrologic Restoration Cameron 6197671.42 296
Chandeleur Islands Marsh Restoration NMFS Barrier Island Restoration Plaquemines, St. Bernard 839927.3 220
New Cut Dune and Marsh Restoration EPA Barrier Island Restoration Terrebonne 10652277.27 102
South Lake Decade Freshwater Introduction NRCS Freshwater Diversion, Shoreline Protection Terrebonne 5223806 202
Timbalier Island Dune and Marsh Creation EPA Barrier Island Restoration Terrebonne 15225089.67 273
Mandalay Bank Protection Demonstration USFWS Demonstration, Shoreline Protection Terrebonne 1732498.12 0
Freshwater Bayou Bank Stabilization – Belle Isle Canal to Lock (Inactive) COE Shoreline Stabilization Vermilion 1101737.99 241
Four Mile Canal Terracing and Sediment Trapping NMFS Sediment and Nutrient Trapping Vermilion 3792936.24 167
Sabine Refuge Marsh Creation, Cycle 1 COE Marsh Creation Cameron 3422432.76 214
Sabine Refuge Marsh Creation, Cycle 2 COE Marsh Creation Cameron 14351767.76 261
Sabine Refuge Marsh Creation, Cycle 3 COE Marsh Creation Cameron 3038248 187
Sabine Refuge Marsh Creation, Cycles 4 and 5 USFWS Marsh Creation Cameron 10328064 331
Humble Canal Hydrologic Restoration NRCS Hydrologic Restoration Cameron 1574926.34 378
Hopedale Hydrologic Restoration NMFS Hydrologic Restoration St. Bernard 2281286.68 134
Lake Portage Land Bridge NRCS Shoreline Protection Vermilion 1181128.92 24
Barataria Basin Landbridge Shoreline Protection, Phases 1 and 2 NRCS Shoreline Protection Jefferson 27852110.92 1304
Vegetative Plantings of a Dredged Material Disposal Site on Grand Terre Island NMFS Vegetative Planting Jefferson 346245.99 127
Pecan Island Terracing NMFS Sediment and Nutrient Trapping Vermilion 2390984.44 442
Thin Mat Floating Marsh Enhancement Demonstration NRCS Demonstration, Marsh Enhancement Terrebonne 538100.79 0
Barataria Bay Waterway East Side Shoreline Protection NRCS Shoreline Protection Jefferson 5224476.97 217
Black Bayou Hydrologic Restoration NMFS Hydrologic Restoration Calcasieu, Cameron 6500707.11 3594
Nutria Harvest for Wetland Restoration Demonstration USFWS Demonstration, Herbivory Control Calcasieu, Cameron, Iberia, Jefferson, Lafourche, Orleans, Plaquemines, St. Bernard, St. Charles, St. Mary, St. Tammany, Terrebonne, Vermilion, St. James, St. John the Baptist, St. Martin, Assumption, Livingston, Tangipahoa 806220.05 0
Delta Wide Crevasses NMFS Water Diversion Plaquemines 4728318.75 2386
Dustpan Maintenance Dredging Operation COE Marsh Creation, Demonstration Plaquemines 1909020.36 0
North Lake Boudreaux Basin Freshwater Introduction USFWS Water Diversion Terrebonne 25766765 266
Penchant Basin Natural Resources Plan, Increment 1 NRCS Hydrologic Restoration Terrebonne 17628814 675
Oaks/Avery Canal Hydrologic Restoration, Increment 1 NRCS Hydrologic Restoration Iberia, Vermilion 2925215.88 160
Marsh Island Hydrologic Restoration COE Hydrologic Restoration Iberia 5143323.48 408
Sediment Trapping at “The Jaws” NMFS Sediment and Nutrient Trapping St. Mary 1653791.98 1999
Cheniere Au Tigre Sediment Trapping Demonstration NRCS Demonstration, Sediment and Nutrient Trapping Vermilion 624999.42 0
Naomi Outfall Management NRCS Outfall Management Jefferson, Plaquemines 2286063.84 633
Sweet Lake/Willow Lake Hydrologic Restoration NRCS Shoreline Protection Cameron 3929151.57 247
Freshwater Bayou Bank Stabilization NRCS Shoreline Protection Vermilion 5609593.06 511
Bayou Chevee Shoreline Protection COE Shoreline Protection Orleans 2589403.01 75
Raccoon Island Breakwaters Demonstration NRCS Barrier Island Restoration, Demonstration Terrebonne 1751046.07 0
Little Vermilion Bay Sediment Trapping NMFS Shoreline Protection, Sediment Trapping Vermilion 886029.62 441
Barataria Bay Waterway West Side Shoreline Protection NRCS Shoreline Protection Jefferson 3013365.37 232
Perry Ridge Shore Protection NRCS Shoreline Protection Calcasieu 2289090.4 1203
Plowed Terraces Demonstration NRCS Demonstration, Sediment and Nutrient Trapping Cameron 325640.54 0
East Timbalier Island Sediment Restoration, Phase 2 NMFS Barrier Island Restoration Lafourche 7600150.49 215
West Pointe a la Hache Outfall Management NRCS Hydrologic Restoration, Outfall Management Plaquemines 5370526 646
Lake Salvador Shoreline Protection Demonstration NMFS Demonstration, Shoreline Protection St. Charles 2801782.42 0
Cameron-Creole Maintenance NRCS Hydrologic Restoration Cameron 4644371 2602
Replace Sabine Refuge Water Control Structures USFWS Marsh Management Cameron 6177135.15 953
Channel Armor Gap Crevasse COE Sediment Diversion Plaquemines 888984.67 936
Mississippi River Gulf Outlet (MRGO) Disposal Area Marsh Protection COE Marsh Creation St. Bernard 318445.27 755
East Timbalier Island Sediment Restoration, Phase 1 NMFS Barrier Island Restoration Lafourche 3621543.58 1913
Lake Chapeau Sediment Input and Hydrologic Restoration, Point Au Fer Island NMFS Hydrologic Restoration, Marsh Creation Terrebonne 6847811.87 509
Whiskey Island Restoration EPA Barrier Island Restoration Terrebonne 7043188.2 1239
Brady Canal Hydrologic Restoration NRCS Hydrologic Restoration Terrebonne 7593751.69 297
Cote Blanche Hydrologic Restoration NRCS Hydrologic Restoration St. Mary 10093908.86 2223
Atchafalaya Sediment Delivery NMFS Hydrologic Restoration, Marsh Creation, Dredged Material St. Mary 2455669.05 2232
Big Island Mining NMFS Hydrologic Restoration, Marsh Creation, Dredged Material St. Mary 7003101.79 1560
Jonathan Davis Wetland Restoration NRCS Hydrologic Restoration Jefferson 28894638.64 510
Caernarvon Diversion Outfall Management NRCS Outfall Management Plaquemines 4536000 802
East Mud Lake Marsh Management NRCS Marsh Management Cameron 5392755.36 1520
Highway 384 Hydrologic Restoration NRCS Hydrologic Restoration Cameron 1586227.37 150
Clear Marais Bank Protection COE Shoreline Protection Calcasieu 3696087.79 1067
Freshwater Bayou Wetland Protection NRCS Hydrologic Restoration, Shoreline Protection Vermilion 6059652.91 1593
Fritchie Marsh Restoration NRCS Hydrologic Restoration St. Tammany 2201673.79 1040
Bayou Sauvage National Wildlife Refuge Hydrologic Restoration, Phase 2 USFWS Hydrologic Restoration Orleans 1692551.58 1280
Point Au Fer Canal Plugs NMFS Hydrologic Restoration, Shoreline Stabilization Terrebonne 5544367.22 375
West Belle Pass Headland Restoration COE Shoreline Protection, Dredged Material Lafourche 6826754.41 474
Isles Dernieres Restoration Trinity Island EPA Barrier Island Restoration Terrebonne 10774974.19 109
Boston Canal/Vermilion Bay Bank Protection NRCS Shoreline Protection, Vegetative Planting Vermilion 1043748.21 378
GIWW (Gulf Intracoastal Waterway) to Clovelly Hydrologic Restoration NRCS Hydrologic Restoration Lafourche 12896358.2 175
Barataria Bay Waterway Wetland Restoration COE Marsh Creation Jefferson 1167831.94 445
Cameron Creole Plugs USFWS Hydrologic Restoration Cameron 1258100.84 865
Sabine National Wildlife Refuge Erosion Protection USFWS Shoreline Protection Cameron 1602656 5542
West Hackberry Vegetative Planting Demonstration NRCS Demonstration, Sediment Trapping, Vegetative Planting Cameron 256250.87 0
Cameron Prairie National Wildlife Refuge Shoreline Protection USFWS Shoreline Protection Cameron 1227123.44 247
West Bay Sediment Diversion COE Water Diversion Plaquemines 50863503 9831
Bayou Sauvage National Wildlife Refuge Hydrologic Restoration, Phase 1 USFWS Hydrologic Restoration Orleans 1680193.18 1550
Bayou LaBranche Wetland Creation COE Marsh Creation St. Charles 3786069.71 203
Falgout Canal Planting Demonstration NRCS Demonstration, Shoreline Protection, Vegetative Planting Terrebonne 206522.81 0
Timbalier Island Planting Demonstration NRCS Barrier Island Restoration, Demonstration, Vegetative Planting Terrebonne 300492.47 0
Isles Dernieres Restoration East Island EPA Barrier Island Restoration Terrebonne 8762415.77 9
Vermilion River Cutoff Bank Protection COE Shoreline Protection Vermilion 2047478.71 65
Coastwide Reference Monitoring System USGS Monitoring Ascension, Calcasieu, Cameron, Iberia, Jefferson, Lafourche, Orleans, Plaquemines, St. Bernard, St. Charles, St. Mary, St. Tammany, Terrebonne, Vermilion, St. James, St. John the Baptist, St. Martin, Assumption, Jefferson Davis, Acadia, Lafayette, West Baton Rouge, East Baton Rouge, Iberville, Livingston, Tangipahoa 114607082

Infrastructure Update: Things Opening Up

El Capitan State Beach is currently slated to re-open to the the general public this Friday, June 26.  El Capitan was heavily oiled beginning late in the day on May 20, 2015 (day 2 of the spill), but was nevertheless exposed to less intense oiling than Refugio State Beach.  Refugio will remain closed for at least an additional two weeks while work crews continue to clean rocky intertidal of deposited tar by hand.

From the Joint Incident Command:

El Capitan State Beach has been cleared by the California Department of Parks and Recreation to re-open, Friday, June 26, 2015.

The California Department of Parks and Recreation and members of the Unified Command completed a site assessment of El Capitan State Beach and deemed it safe for the public, Thursday, June 18, 2015. While the beach will be open June 26 for camping and day use, State Parks personnel requests that campers do not check in until 12:00 p.m.

Reservations at Refugio State Beach have been cancelled until July 9. Additional reservations may be cancelled depending on the progress of the clean-up operation.  State Parks staff will continue to monitor the cleanup and re-evaluate the closures.  Any affected reservation holders will be notified by e-mail and voicemail of future cancellations. Campers with reservations that experienced additional impacts from the Refugio crude oil release should call the toll-free claims line at 1-866-753-3619.

Please monitor the State Parks webpage for status updates at http://goo.gl/ZwWU6d.

The JIC remains very interested in telling you that everything is okay.  They have unfortunately demonstrated a pattern of releasing essentially no information with any detail or with any timeliness.  For example, while they are anxious for you to know El Capitan is opening back up, the most recent beach oiling map they will provide is nearly a week old.

Refugio Beach Oiling Map as of 06-16-15.  Source: Joint Incident Command

Refugio Beach Oiling Map as of 06-16-15.  Note: the Refugio-El Capitan region is the section with the most oil remaining (red and orange color herein). Source: Joint Incident Command

To be clear, our observations suggest there is little significant threat to beach goers in this region.  But the lack of free flowing information and the massively superficial nature of most of the information released to date has been disappointing.

While the public access is slated to improve over the coming weeks, the prospect for routine oil pumping is limited.  The oil movement infrastructure remains compromised.  Plains All American has yet to comment on the date for the restoration of flow in this trunkline of their pipeline.  Some folks are quoting a year to get it up and running, but don’t believe those silly timelines.  Exxon’s request to move oil via increased tanker trucks has been stymied for the time being and the tank farm on the Refugio coast is now at full capacity.  The three offshore platforms that feed into this facility have now been shut in and are not producing and petroleum.

KEYT 3 News Reports that four platforms are now shuttered in the wake of the Refugio Spill.

KEYT 3 News Reports that four platforms are now shuttered in the wake of the Refugio Spill.

Summer Institute

Upcoast El Matador 06-09-15 IMG_1746 IMG_1764 IMG_1765 IMG_1767 IMG_1768

We are just wrapping up another fantastic three weeks with our annual installment of Project ACCESO’s Summer Institute.  This program, funded by the Department of Education, blends CSU Channel Islands undergrads with undergraduate from community colleges across our region.  This year, our ESRM team was fortunate to have student researchers from Santa Barbara City College, Oxnard College, Ventura College, and Moorpark College join our ESRM students.  While most faculty engage in interesting independent projects with their student researchers, our ESRM Program has a strong tradition of doing a single, integrated project wherein all faculty collaborate and we share our students across all our sub-projects.

Sandy beaches have been the focus of our Summer Institute for the past several years.  This year we obviously pivoted to focus on the oil spill’s impacts upon sandy beaches.

Our students will be graduating tomorrow in a late afternoon ceremony at CSU Channel Islands.  The event is open to all.  If anyone is in the area, pop on by to see our students’ work on the spill.


Here is a little taste of their work:

First hints at changing perceptions

Our on-going public opinion polling of beach goers in the wake of the Refugio Oil Spill is beginning to show some interesting patterns.  We are still in the midst of collecting data (check back in a week or two when we have had a chance to fully explore this data coming in daily), but a few trends are beginning to come into focus.

Anonymous beach goer taking our brief opinion survey in the make of the Refugio Oil Spill at Haskell's Beach in Santa Barbara a few days after the pipeline break.

Anonymous beach goer taking our brief opinion survey in the make of the Refugio Oil Spill at Haskell’s Beach in Santa Barbara a few days after the pipeline break.

For example, there appears to be a difference in the public’s perception of the safety of seafood from the Santa Barbara area in the wake of the Refugio Spill.  As we have seen with the Deepwater Horizon in the Gulf of Mexico, the Fukushima disaster in Japan, and several other recent coastal catastrophes, the public is quick to take a dim view of the safety of food from impacted areas.  We have already seen a change in the perception of the safety of seafood from Santa Barbara relative to other regions of California (see figure below).

Our surveys ask if people feel seafood from various regions of the globe is safe to eat.  Below you will see our interim results as of this past Wednesday.  In the wake of the spill there is now an apparent hesitancy amongst a subset of the public with regards to consuming seafood from the spill-affected (and as always happens in such situations) and nearby regions.  This whole matter is complicated by the fact most people don’t ask about where their seafood comes from on a day-to-day basis, but that is a discussion for our post on seafood.


Is seafood from here safe to eat?

Other changes in levels of public sentiment are becoming evident.  This is perhaps best exemplified by changed support/opposition for offshore drilling off of our California coast.  As you may well expect, we have been finding decreased support in recent weeks for offshore oil and gas drilling in California waters relative to our “normal” opinions collected each fall (where we conduct 1,000 to 1,500 in person surveys each year from mid September to mid October).  The graph below contrasts our most recent fall data (2014) to data we have been collecting over the last few weeks.


reduced support for CA offshore drilling post spill<br><sub>CSUCI Coastal Opinion Polls: Sept 2014 vs. June 2015</sub>

We are also beginning to see the shaping up of possible geographic patterns of perceptions and behaviors related to the intensity of tar a region received over the past few weeks.  An example of this is our willingness to spend money based on where we are and how long we might stay around.  As of yet this is only hinted at in the patterns of responses we are seeing (i.e. it is not yet statically significant).  But as we increase our sample size, we may well see these differences become robust and statistically significant.  Unlike seafood, I would expect this effect to be comparatively fleeting.  Assuming this is a truly significant trend we are documenting, my best guess is that such a difference would have disappeared by the end of the summer tourist season (barring some unforeseen new development that would keep the spill in the public’s eye). The following figure hints that the more tarring a site accumulates, the lower the financial input to that beach and adjacent areas from beach-going visitors.  Presumably this is being driven by the fact that people are less likely to stay around.  I should note that these sites are not necessarily clumped in one or two spots adjacent to Refugio; the recent tarring across our region has afforded us a much more robust opportunity to study such questions without the typical spatial autocorrelation (that’s fancy statical talk for the problem that we sometimes have a situation where chance and happenstance corrupt our nice, objective exploration of the natural world and render powerless our normal tools to detect differences).  This data comes from more than 33 beaches/sampling points across our study region in coastal southern California.

How much money have you spent/will you spend at the beach this week?

My students, colleagues, and I are very keen to explore further the interactions across these coupled human-natural systems.  Many hypotheses and patterns are available for us to test given our wealth of long-term annual surveys and dozens of recent beach ecological assessments we have conducted over the previous weeks and years.  If only we didn’t need to sleep, we would have these analyses done by now!

Stay tuned.

This Toxic Tar

Spoiler Alert: Our experiments are showing tar balls washing up on our beaches to be toxic to our local sand crabs.  If you are looking for that info, scroll to the Tar’s Toxicity heading at bottom of this post.  If you want get a brief primer on Ecotoxicology, then start right here…

A brief history of poisons: French Regicide to New York City

Françoise Athénaïs de Rochechouart de Mortemart, marquise of Montespan (5 October 1640 – 27 May 1707), mistress of King Louis XIV of France during Affaire des Poisons from the 1670s to the 1680s.  Image Source: Wikicommons

Françoise Athénaïs de Rochechouart de Mortemart, marquise of Montespan (5 October 1640 – 27 May 1707), mistress of King Louis XIV of France during Affair of the Poisons which ran from 1677–1682.. Image Source: Wikicommons

Our modern understanding of toxins in the western world traces back to the proliferation of targeted poisonings across Europe several hundred years ago.  The Europe of 500 years ago was dominated by monarchies where royal houses typically bred with only a handful of other royal houses.  Only a very select few of those offspring were in turn able to become the ultimate ruler (the king or queen) of kingdom X or empire Y.  Those kings and queens tended to hold their position for life.  Add in the fact that the royal courts and/or church didn’t typically take kindly to a next in line for the throne offing the king or even the apparent or king just so they could move into that anointed position.  Would be rulers were therefore in something of a tight spot.  What was a scheming, covetous, inbred to do?  Cue the dramatic music and the rise of the widely popular art of poisoning your older sister or brother in ever uneventful ways and with ever more creative toxins.  This forerunner of our modern field of toxicology spurred numerous clandestine experts who knew of the right amount of substance X and how to deliver them in unseen ways so as to produce the funeral you desired.  Examples ranged from the tabloid Affair of the Poisons (a huge French scandal spanning 1677–1682 that led to the execution of 36 courtesans) to the more “traditional” politically calculated killings such as that of Moscow’s Dmitry Shemyaka in 1453.

It was all very Game of Thrones-esque.

Alexander Gettler (far right) and Charles Norris (seated, left) in the toxicology laboratory located on the third floor of the City Morgue, Bellevue Hospital circa 1922.  Image source: Wikimedia Commons.

Alexander Gettler (far right) and Charles Norris (seated, left) in the toxicology laboratory located on the third floor of the City Morgue, Bellevue Hospital circa 1922. Image source: Wikimedia Commons.

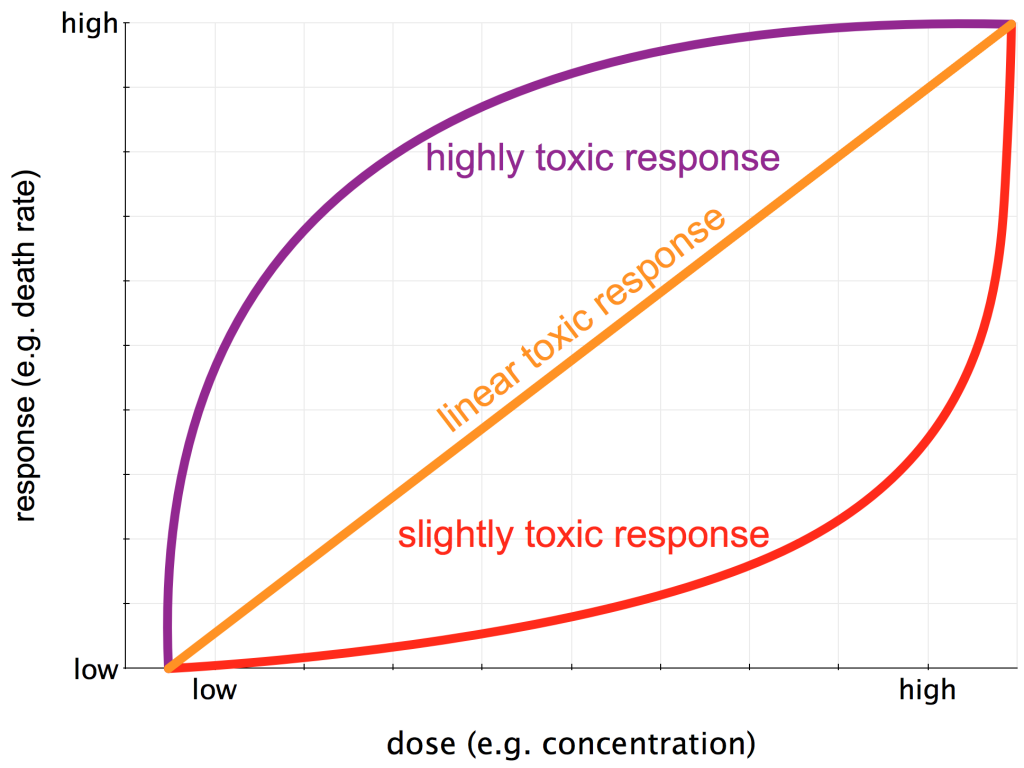
While medieval courtesan intrigue way over in Europe may seem only tenuously related to our modern field of ecotoxicology, it quite literally laid our foundations.  First and foremost this gave us the central underpinnings of toxic exposure.  This concept would eventually become more widely known now as a Dose-Response Curve.  The idea here is that almost any substance can be lethal in high enough quantities.  The corollary is that any poison can cause you no harm if you get exposed to it in small enough quantities.

The classic Dose-Response Curve began to take on the cloak of scientific rigor with the birth of the modern forensics unit in New York City at the turn of the 20th century.  Alexander Gettler became the first professional forensic toxicologist in the United States, employed by New York City between 1918 and 1959.  Gettler, his boss Charles Norris (America’s first medical examiner to work with rigorous, scientific methods), and their colleagues established a laboratory which (among other things) quantitatively explored the Dose-Response Curves for a wide range of substances.  Much effort went into characterizing toxins via the types of toxic response they manifest in the target organism (see my figure below).  If this is even vaguely of interest to you, I’d HIGHLY recommend The Poisoners Handbook by science writer and Pulitzer-Prize winner Deborah Blum.

Three potential Dose-Response Curves.

Three potential Dose-Response Curves.  The dose (x-axis) could be concentration, frequency of exposure, or length of exposure., The response (y-axis) could be anything from a sublethal outcome such as a headache to outright death.

Rachel Carson holding her ecotoxicological treatise Silent Spring.  Image: Rachel Carson Archives

Rachel Carson holding her ecotoxicological treatise Silent Spring. Image: Rachel Carson Archives

The Dose-Response Curve remained more or less tightly grounded in human (and domestic animal) toxicology for several decades more until Rachel Carson’s landmark 1962 treatise Silent Spring.  That book served as a clarion call for exploring the effect of poisons on non-human elements of our biosphere and the potential wide-ranging effects on entire ecosystems that can emanate from the poisoning of a single population.

By 1970, the French toxicologist Dr. René Truhaut had coined the term ecotoxicology.  Truhaut defined ecotoxicology as.

The branch of toxicology concerned with the study of toxic effects, caused by natural or synthetic pollutants, to the constituents of ecosystems, animal (including human), vegetable and microbial, in an integral context.

Soon ecotoxicology programs began springing up across universities worldwide.  I could go on for pages about the rapid evolution of ecotoxicology since 1970 (the discovery of endocrine disruptors, modern whole-system ecotoxicology, etc.) but that is the subject for a future discussion…

The toxic components of crude oil

Large tar ball just deposited at El Matador State Beach.  June 9, 2015.

Large tar ball just deposited at El Matador State Beach. June 9, 2015.

Crude oil is a complex mixture of dozens and dozens of compounds.  We typically think of the diverse array of hydrocarbons that comprise the “oil” itself, but there can be tons of other things hitching a ride and mixed up in the chemical soup that was hanging out underground for millions of years.  These tagalongs include heavy metals, sulfur, etc. and have their own toxic responses But for now, let’s stick to the basic hydrocarbon components as the variety of chemical structures in there is enough to boggle the mind.

As an aside: In graduate school we used to teach up-and-coming ecotoxicologists about toxicity via a series of labs exploring creosote.  Creosote is the tarry substance that we historically impregnated wood with when we wanted a given post or beam to survive the ravages of structure-damaging organisms (boring worms that attack pier pilings, woodpeckers that attack telephone poles, etc.).  That stuff was always crazy toxic and often sparked long discussions about the rainbow of potential poisonous compounds within the creosote that might be responsible for the toxicity we were observing in our instructional, classroom experiments.  But we always ended up coming back to those good ol’ hydrocarbons when push came to shove.  Those hydrocarbons are some amazingly lethal substances, especially when mixed with sunlight.  But back to the the focus of this post…

Representations of Benzene.  Image: Matthias M., CC BY-SA 3.0

Representations of Benzene. Image: Matthias M., CC BY-SA 3.0

The hydrocarbons in crude oil generally come in one of two flavors: alkanes and aromatics.  Alkanes are the less poisonous of the two and are relatively quickly degraded in the environment by the local microbial community or strong sunlight/UV radiation.  Aromatics (molecules centered around 6-carbon rings) could be described as the problem child of the crude oil family.  Aromatics are generally the most toxic fraction of the crude.  The majority of research into the aromatic fraction of oil has centered around the most problematic of these problem children; polycyclic aromatic hydrocarbons (PAHs), molecules with multiple carbon rings.  PAHs have the ability to hang around for a comparatively long time in water and soils (what ecotoxicologists refer to as environmental persistence) as well as within the bodies of critters exposed to crude oil (especially in their fat).

https://en.wikipedia.org/wiki/BTX_(chemistry)#/media/File:Benzene_Toluene_and_ortho-,meta-,and_para-xylene.svg

Examples of the structure of the BTEX hydrocarbons in crude oil. Image source: Wikipedia

The most abundant and well-characterized crude oil PAHs are the so-called “BTEX” molecules: Benzene, Toluene, Ethylbenzene and Xylenes.  Of these, Benzene is the most abundant and best understood.  It is often present in concentrations as high 4 g/l in crude oil and can be at levels close to 1 ppb in seawater near oil or gas seeps (IPCS 1993).  Non-petroleum, natural sources of BTEX include volcanic emissions and forest fires.  We also love to use this solvent (and the other BTEX compounds) in industrial contexts across the globe.


Those Poisonous PAHs

Acute toxicity (short term exposure; minutes but usually hours to days) from the BTEX PAHs is well documented upon a wide variety of aquatic critters.  In moderate concentrations, these PAHs can kill things pretty quickly, especially if we are talking about water-dwelling invertebrates (particularly when that water is stratified or relatively confined) or animals breathing in air rich with PAH vapors (such as we found on PCH in the immediate vicinity of the pipeline break on May 19).  Short of killing you, breathing in a comparatively low concentration of these things can induce dizziness, euphoria (this is why teenagers sometimes huff gasoline fumes), nausea, blurry vision and headaches.  Several of us who visited and/or drove past the Refugio spill site on May 20 experienced a rapid (within minutes) onset of headaches and nausea, most likely due to these unusually high concentration of these aromatic compounds in the air.

Chronic toxicity (long term exposure; weeks to years) from BTEX PAHs include damage to the liver, kidneys, heart, lungs, and nervous system of vertebrates.  Impacts span cancer, developmental problems, reproductive failure, endocrine disruption, and even genotoxicity (the screwing up of your genetic code).  Suffice it to say, this is all bad.  Most of these effects have been characterized in model vertebrate systems (aka lab mice and estuary-dwelling fish).  Mechanistic work on the toxicity of exposed invertebrates is getting better every year, but we still lack a good understanding of this for many species.


BTEX concentrations in the environment (after Leusch & Bartkow 2010)

Reported concentrations of benzene, toluene, ethylbenzene and xylene (BTEX) in air and water (in parts per billion). After Leusch & Bartkow 2010.

  Benzene Toluene Ethylbenzene Xylenes
Air (μg/m3)
Remote rural area 0.2 – 16 0.5 – 260 0.2 – 1.6 <0.1 – 3
Urban center, heavy traffic Up to 349 Up to 1,310 Up to 360 Up to 775 density
Water (ppb or μg/L)
Surface water: clean <0.1 – 2.1 <1 – 15 <0.1 – 1.8 <0.1 – 1.2
Surface water: contaminated Up to 100 unknown Up to 15 Up to 32
Groundwater: clean <0.1 – 1.8 <1 ‐ 100 <0.1 – 1.1 <0.1 – 0.5
Groundwater: contaminated Up to 330 Up to 3,500 Up to 2,000 Up to 1,340
Drinking water <0.1 – 5 <1 – 27 <1 ‐ 10 <0.1 – 12

Tar’s Toxicity: our recent Refugio oil experiments

With that long-winded preamble, the big question everyone keeps asking us is:

Is all this tar washing up on our beaches toxic?

We are working on this as we speak, but our initial results are instructive.  And the answer seems to be yes.

As I have discussed before, sandy beach-dwelling organisms are particularly at risk in this Refugio spill.  My colleagues, students, and I are now supplementing our field surveys with laboratory experiments.

We have begun to explore the toxicity of the tar landing on our SoCal beaches with our model organism for this spill: the sand crab Emerita analoga.

We have found that both weathered and comparatively fresh tar landing on our local beaches both kills and screws with the normal activity of our sand crabs.

Refugio spill tar is toxic to sand crabs<br>acute mortality

At this early stage, we can’t pinpoint the specific mechanism of toxicity.  But this tar clearly has the potential to kill our sandy beach animals.  We are working on estimates of how many might have been killed or been put at risk of being killed by this oiling of our beaches, but that will take some time.  In the meantime, we can now say that these tar balls pitter-pattering upon our beaches from Santa Barbara to Orange County over these past few weeks are clearly toxic to our local sand crabs, the cornerstones of our sandy beach food web.  This may not be the death knell to these populations, but it clearly was not a good thing for the ecology of our sandy beach ecosystem.

Refugio spill tar is toxic to sand crabs<br>sublethal effects: swimming

In other words, if you were a sand crab princess grumbling in a frustrating holding position as you impatiently waited for your turn to become the next queen, a little bit of strategically placed Refugio tar could easily hasten your ascent to the throne.