Posts

Carpinteria State Beach

Well this week has been truly busy, we had a Steve Whitiker come in and talk about sandy beach monitoring to the high school students that was Wednesday 2/17. Then on Thursday 2/18 the two high school classes went out to Carpinteria State Beach to finally do the research that we have been training them for. It was a long day and it started out with all of us going to the Sea Lion rookery that is right there. We saw a lot of seals and there were a number of pups there. So that was really cool for them to see. Then there was a state park ranger that came by and talked to the kids about the Chumash and the history of the beach. After that we had pizza for lunch and the kids had time to explore a bit.


Now the research begins. This was a very long day because it was very windy and there were a lot of students that came up to the rocky intertidal area at the same time so it got a little crowded but over all it went very well and I am very happy with how it all went.

The same thing happened with the middle school but there was no wind but the surf was still really high and there were a lot more of them but it still went very well.

our little rock has so many people

Weekend Trip to Santa Cruz Island

I went out to Santa Cruz Island this weekend to see if there had been any successful germination in my plots from the seed mixture that I broadcasted about a month ago. I’m happy to report that there has been successful germination! I documented the progress and hope to go out to Santa Cruz in another few weeks to check again. I’m hoping for some more rain in March for continued success.

Preliminary Results

I have started to analyze the data from all of my field collection. So far, I have found that beach grooming significantly reduces sand crab population density. I have also found that the change in season has coincided with the reduction in invertebrate species richness. I hope further data analysis will reveal more significant relationships between invertebrate community health and natural or anthropogenic stressors.

groomingtemporal

harrison in the waves


The Great Oil Miscalculation

It is hard to underestimate the influence our Federal Energy Information Agency (EIA) has on energy markets.  Their annual and quarterly reports, littered with predictions, drive investments, public policy, and global understanding of energy production and consumption.

So the recent coming to terms with the fact that the EIA has of late been hugely overestimating American petroleum consumption is cause to sit up and take notice.  A very readable overview of this overestimate was pulled together this past summer by Lydia Cox for the World Economic Forum:

US oil production has transformed itself fundamentally in the past decade.  Between 1970 and 2008, US crude oil production fell by nearly half as conventional wells were depleted.  Since 2008, however, production has rebounded from 5 million barrels per day to an average of 8.7 million barrels per day in 2014.  The almost entirely unexpected increase – largely attributable to technological innovations such as advances in horizontal drilling, hydraulic fracturing, and seismic imaging – has helped the US become the world leader in oil production.

Whereas the developments in oil production have been widely reported and appreciated, far less attention has been paid to US petroleum consumption’s remarkable decline relative to both recent levels and past projections — one of the biggest surprises to have occurred in global oil markets in recent years.  Petroleum consumption in the US was lower in 2014 than it was in 1997, despite the fact that the economy grew almost 50% over this period.  As illustrated in Figure 1, consumption rose steadily from 1984 through the early 2000s, peaking in 2004 before decreasing in conjunction with rising oil prices.
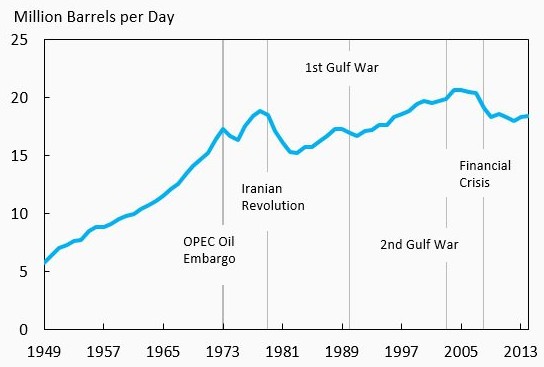
US petroleum consumption from 1949-2014 in millions of barrels per day, 1949-2014. Figure: Energy Information Administration (cited in Cox 2015).

US petroleum consumption between 1949 and 2014 (in millions of barrels of crude oil per day). Figure: Energy Information Administration (as cited in Cox 2015).

The deviation from the EIA’s estimation from more than a decade ago for our American consumption is sizable:

Deviation between historic (2003) and current (2015) EIA predictions of U.S. petroleum consumption to 2025. Figure: Energy Information Administration (cited in Cox 2015).

Deviation between historic (2003) and current (2015) EIA predictions of U.S. petroleum consumption to 2025. Figure: Energy Information Administration (cited in Cox 2015).

Unfortunately this massive deviation from the expected growth in oil consumption is a uniquely American phenomenon and primarily a transportation sector phenomenon.  Simply put, we are burning less gas a diesel in our cars and trucks due to two main factors:

  • reduced miles driven on average (formally referred to as Vehicle Miles Traveled, VMT)
  • improved fuel efficiency
Reduced oil consumption owes almost entirely to improved fuel consumption rate and reduced vehicle miles traveled in the transportation sector. Figure: Energy Information Administration (cited in Cox 2015).

Reduced oil consumption owes almost entirely to improved fuel consumption rate and reduced vehicle miles traveled in the transportation sector. Figure: Energy Information Administration (cited in Cox 2015).

To date the reduced miles driven accounted for the majority of fuel savings,   As Cox explained:

Between 2003 and 2014, gasoline prices explain a large share of the fuel economy increase of the light-duty fleet.  However, over time we expect fuel economy standards to have a growing influence on fuel economy — both for the light- and heavy-duty fleets.  Fuel consumption from the heavy-duty fleet accounts for one-fifth of total transportation sector consumption, and is the fastest growing component in the transportation sector.  New heavy-duty fuel economy standards that the Administration has announced will reduce actual transportation sector consumption relative to even the 2015 projections, which do not reflect these new standards.

Given the importance of miles travelled in explaining the surprises, we use household survey data to present new evidence on the factors underlying the changes.  Demographics appear to explain a very large portion of the vehicle miles travelled developments, but we also find evidence that the effects of demographics and economic variables on vehicle miles travelled have changed over the past 20 years.  Such changes present a major challenge to projecting future petroleum consumption.

On into the future, improved fuel efficiency via improving Corporate Average Fuel Efficiency (CAFE) standards will become to greater driver of lowered consumption:

In 2014, rising fuel economy explains roughly 25% of the consumption surprise, and vehicle miles travelled explain the remaining three quarters.  In the 2025 projections, however, the factors are more comparable, with fuel economy accounting for 45% of the surprise and vehicle miles travelled accounting for 55%, demonstrating the growing rule of public policies like fuel economy standards in shaping fuel use.

In sum, the high gas prices we have been seeing over the past decade have helped curb our driving habits and ultimately lead to our burning less fuel.  Over the coming decade, our current Clean Energy Strategy Policy will likely be at the root of this reduce oil consumption.  In and of itself it is not strong enough to get us to a sustainable future.  But this dramatic reduction in estimated oil consumption shows effective policy and clear drivers can indeed push our US economy into a low carbon future.  This can work.

References

Cox, Lydia.  2015.  The surprising decline in US petroleum consumption.  World Economic Forum Blog.  Posted July 10, 2015.  Accessed February 21, 2015.

Carpinteria State Beach Field Trip

This week we had a field trip to Carpinteria State Beach, the students had many activities one was to look a Harbor seals. The students really enjoyed looking at then and for most students this was the first time they saw a Harbor Seal. The second activity was a presentation from a park ranger about the Chumash and how they used Carpinteria resources. After that students either did sandy beach monitoring, rocky intertidal monitoring, and explored the tide pools. Every student on this trip was excited since it was the first time most explored a tide pool. Many expressed their excitement to me after the activities. Here are some pictures from the trip.

IMG_6075IMG_6069

Picture one are students exploring the tide pools and picture two are students doing sandy beach monitoring.

I have some preliminary results!

Slide1

Today I finished processing the 20th sample population of sand crabs and put together a small graph to share.

The sample sites are listed from North to South along the California coast.  Each bar represents a percentage of the sample population collected that was found to have ingested microparticles.  Of the 20 sample populations, two did not have any micro particle ingestion, however the other 18 sample populations had sand crabs that ingested microparticles.    Each sand crab found to have microparticles was photographed and recorded. I am interested to see how the rest of my samples look and plan to have a more complete set of results in the next 2-3 weeks.

Field Methods

Today, I am going to take some time to describe what it is I do when I’m out on the island counting trees.  Most days, I have to hike up the mountain to my site where I peel off the road and clime down a cliff to my trees.  Once, I find a tree I walk up to it and get as close as possible as the tree stabs me with its branches and then I mark a way-point on my GPS.  Then, I take the diameter and breast height (DBH) and write down the height, health, and whether or not the tree is reproductive.  For my day of collections i split the grove up into four sections  and randomized my selection of trees.  I would look for trees that were reproductive and gather three pine cones from each tree.

Here is a picture of my taking the DBH of a small Bishop pine.

DCIM100GOPROGOPR0277.

And here is a picture of me collecting pine cones from a Bishop pine.  The tree was a little awkward so I had to climb on top of the tree to get to the pine cones.

DCIM100GOPROGOPR0281.

Current progress

I completed a draft of my methods section to the research project . I have entered all the data into the computer and have been working on making an appropriate map of my site locations using ArcGis. My next trip to the island will be on March 21. During this trip i plan on staking the rebar at each site to allow for future research to be done at the same locations. DylanCapstoneupdated

GIS

Everyone in class has a map due this week. I took GIS two years ago, and have completely forgotten how to do basic functions since. After a bit of googling, I was able to create a basic map. This is far from the final map, but I’ve learned I need to hone my GIS skills soon.

Locations of Cameras map

First Draft Map

DM_map1So here is a first look at the invasive plants in my first sampling site. Definitely needs some more work but as you can see there is not too much in terms of the plants that need to be managed.