This week I spent some time in the Owens Valley and Eastern Sierra mountain range learning about water management in Southern California. The Torrey pine has only two remaining locations that are both in Southern California, SRI and San Diego. Both locations are experiencing extreme drought which may be a contributing factor to species decline. This is most prominently seen in the San Diego population where the synergistic effect of drought and bark beetle are being observed with a higher rate of mortality.
Below is a picture of me on the recent trip above Rush Creek Dam and Powerplant.
Well I went to the Channel Islands High School and I gave them the last survey. It was good I was a little sad because I won’t be seeing them until April when we go to Santa Rosa.
I have also just started to get all of my data into one place where I can start getting an idea of what it is showing me. I had a meeting with Sean Anderson to talk about what I should be looking for in my data and how I should proceed So that is what it is all looking like. I hope that all of my data turns out well
My data
https://cikeys.com/wp-content/uploads/2022/09/CI-Formal-Logo_2A-flat-300x50-1.jpg00Hayden Mcphersonhttps://cikeys.com/wp-content/uploads/2022/09/CI-Formal-Logo_2A-flat-300x50-1.jpgHayden Mcpherson2016-03-07 23:40:222016-03-07 23:40:22Last Survey and data stats
Despite working with cameras for my capstone, I have yet to have a photo of myself working. I’m heading back out over spring break with Dr. O’Hirok’s stream team, I’m sure there will be ample opportunities for field photos then. In the mean time, this is the best I have. The Lobo Canyon camera, capturing the back of my legs the last time I checked it.
The past few weeks have consisted of compiling all my data and organizing it into tables. Here is a table showing chlorophyll levels in each stream section over time.
The common garden has shown no growth yet. This past weekend, I went to Owens Valley for my Water Resource Management class, so I had my friend Melinda water the plants and she found no growth. I am hoping to see some growth by the end of this week.
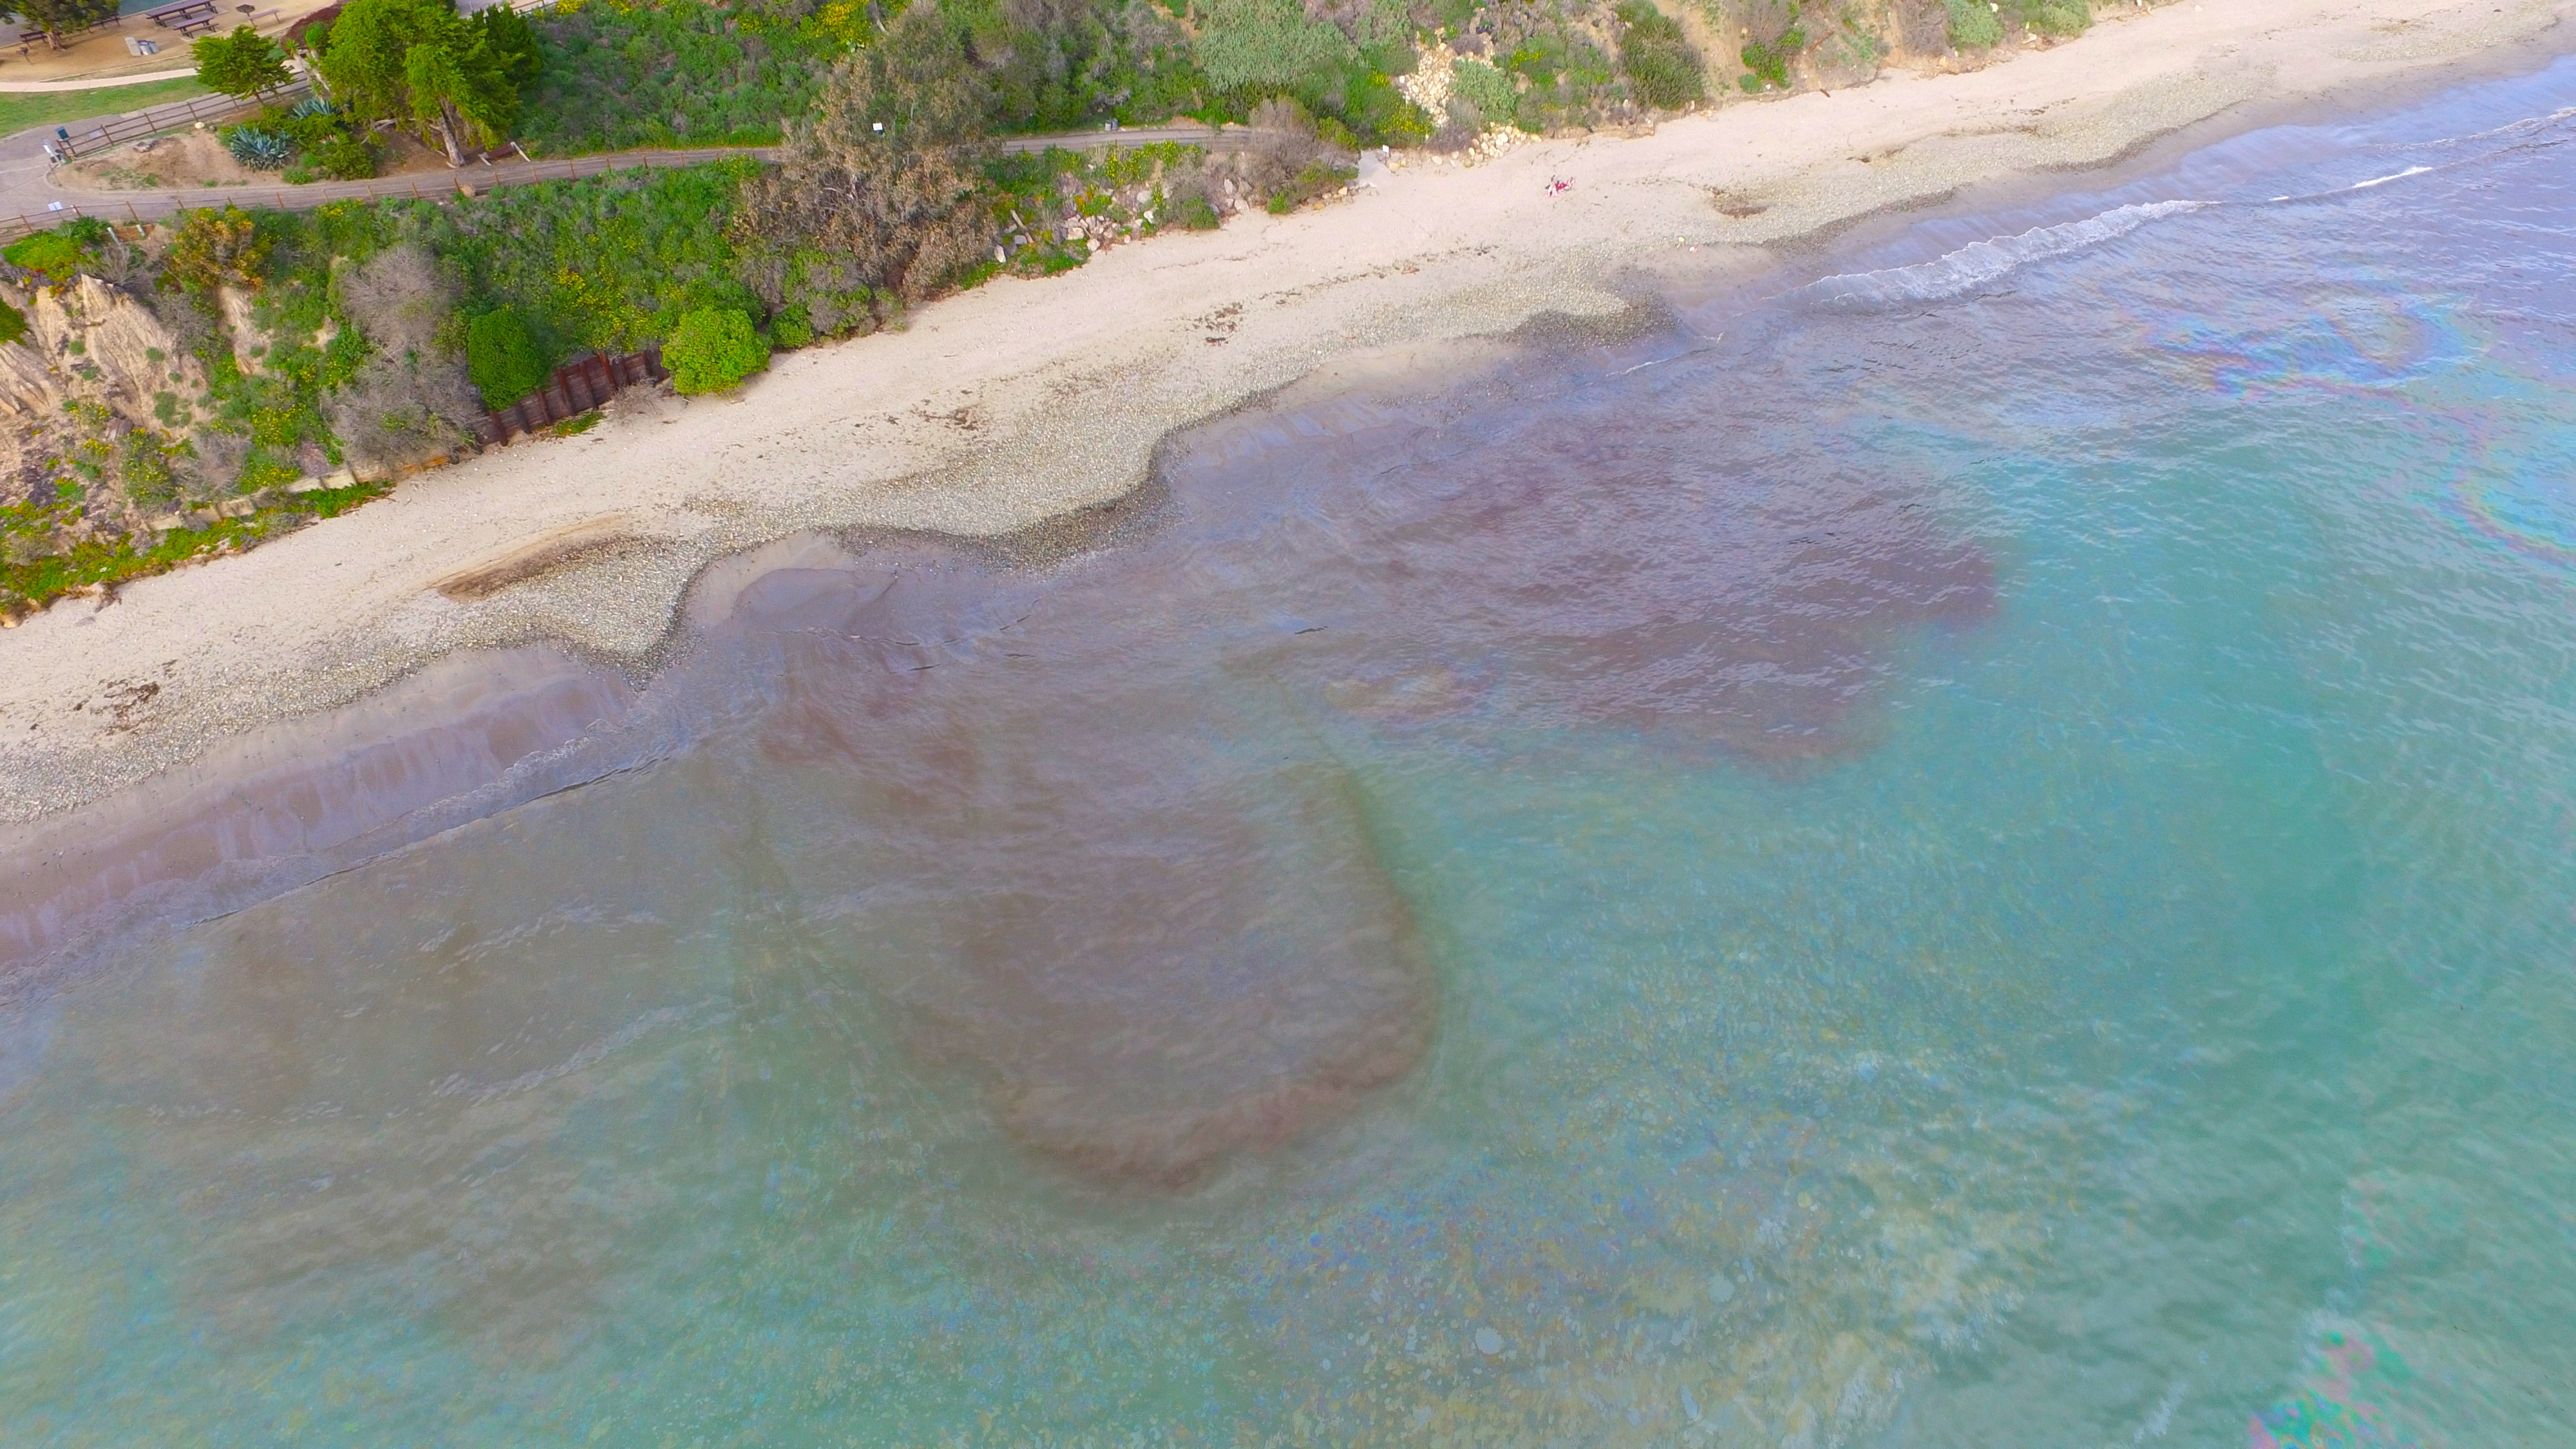
Summerland, CA Beach just below Lookout Park. Image: Harry Rabin, 2016
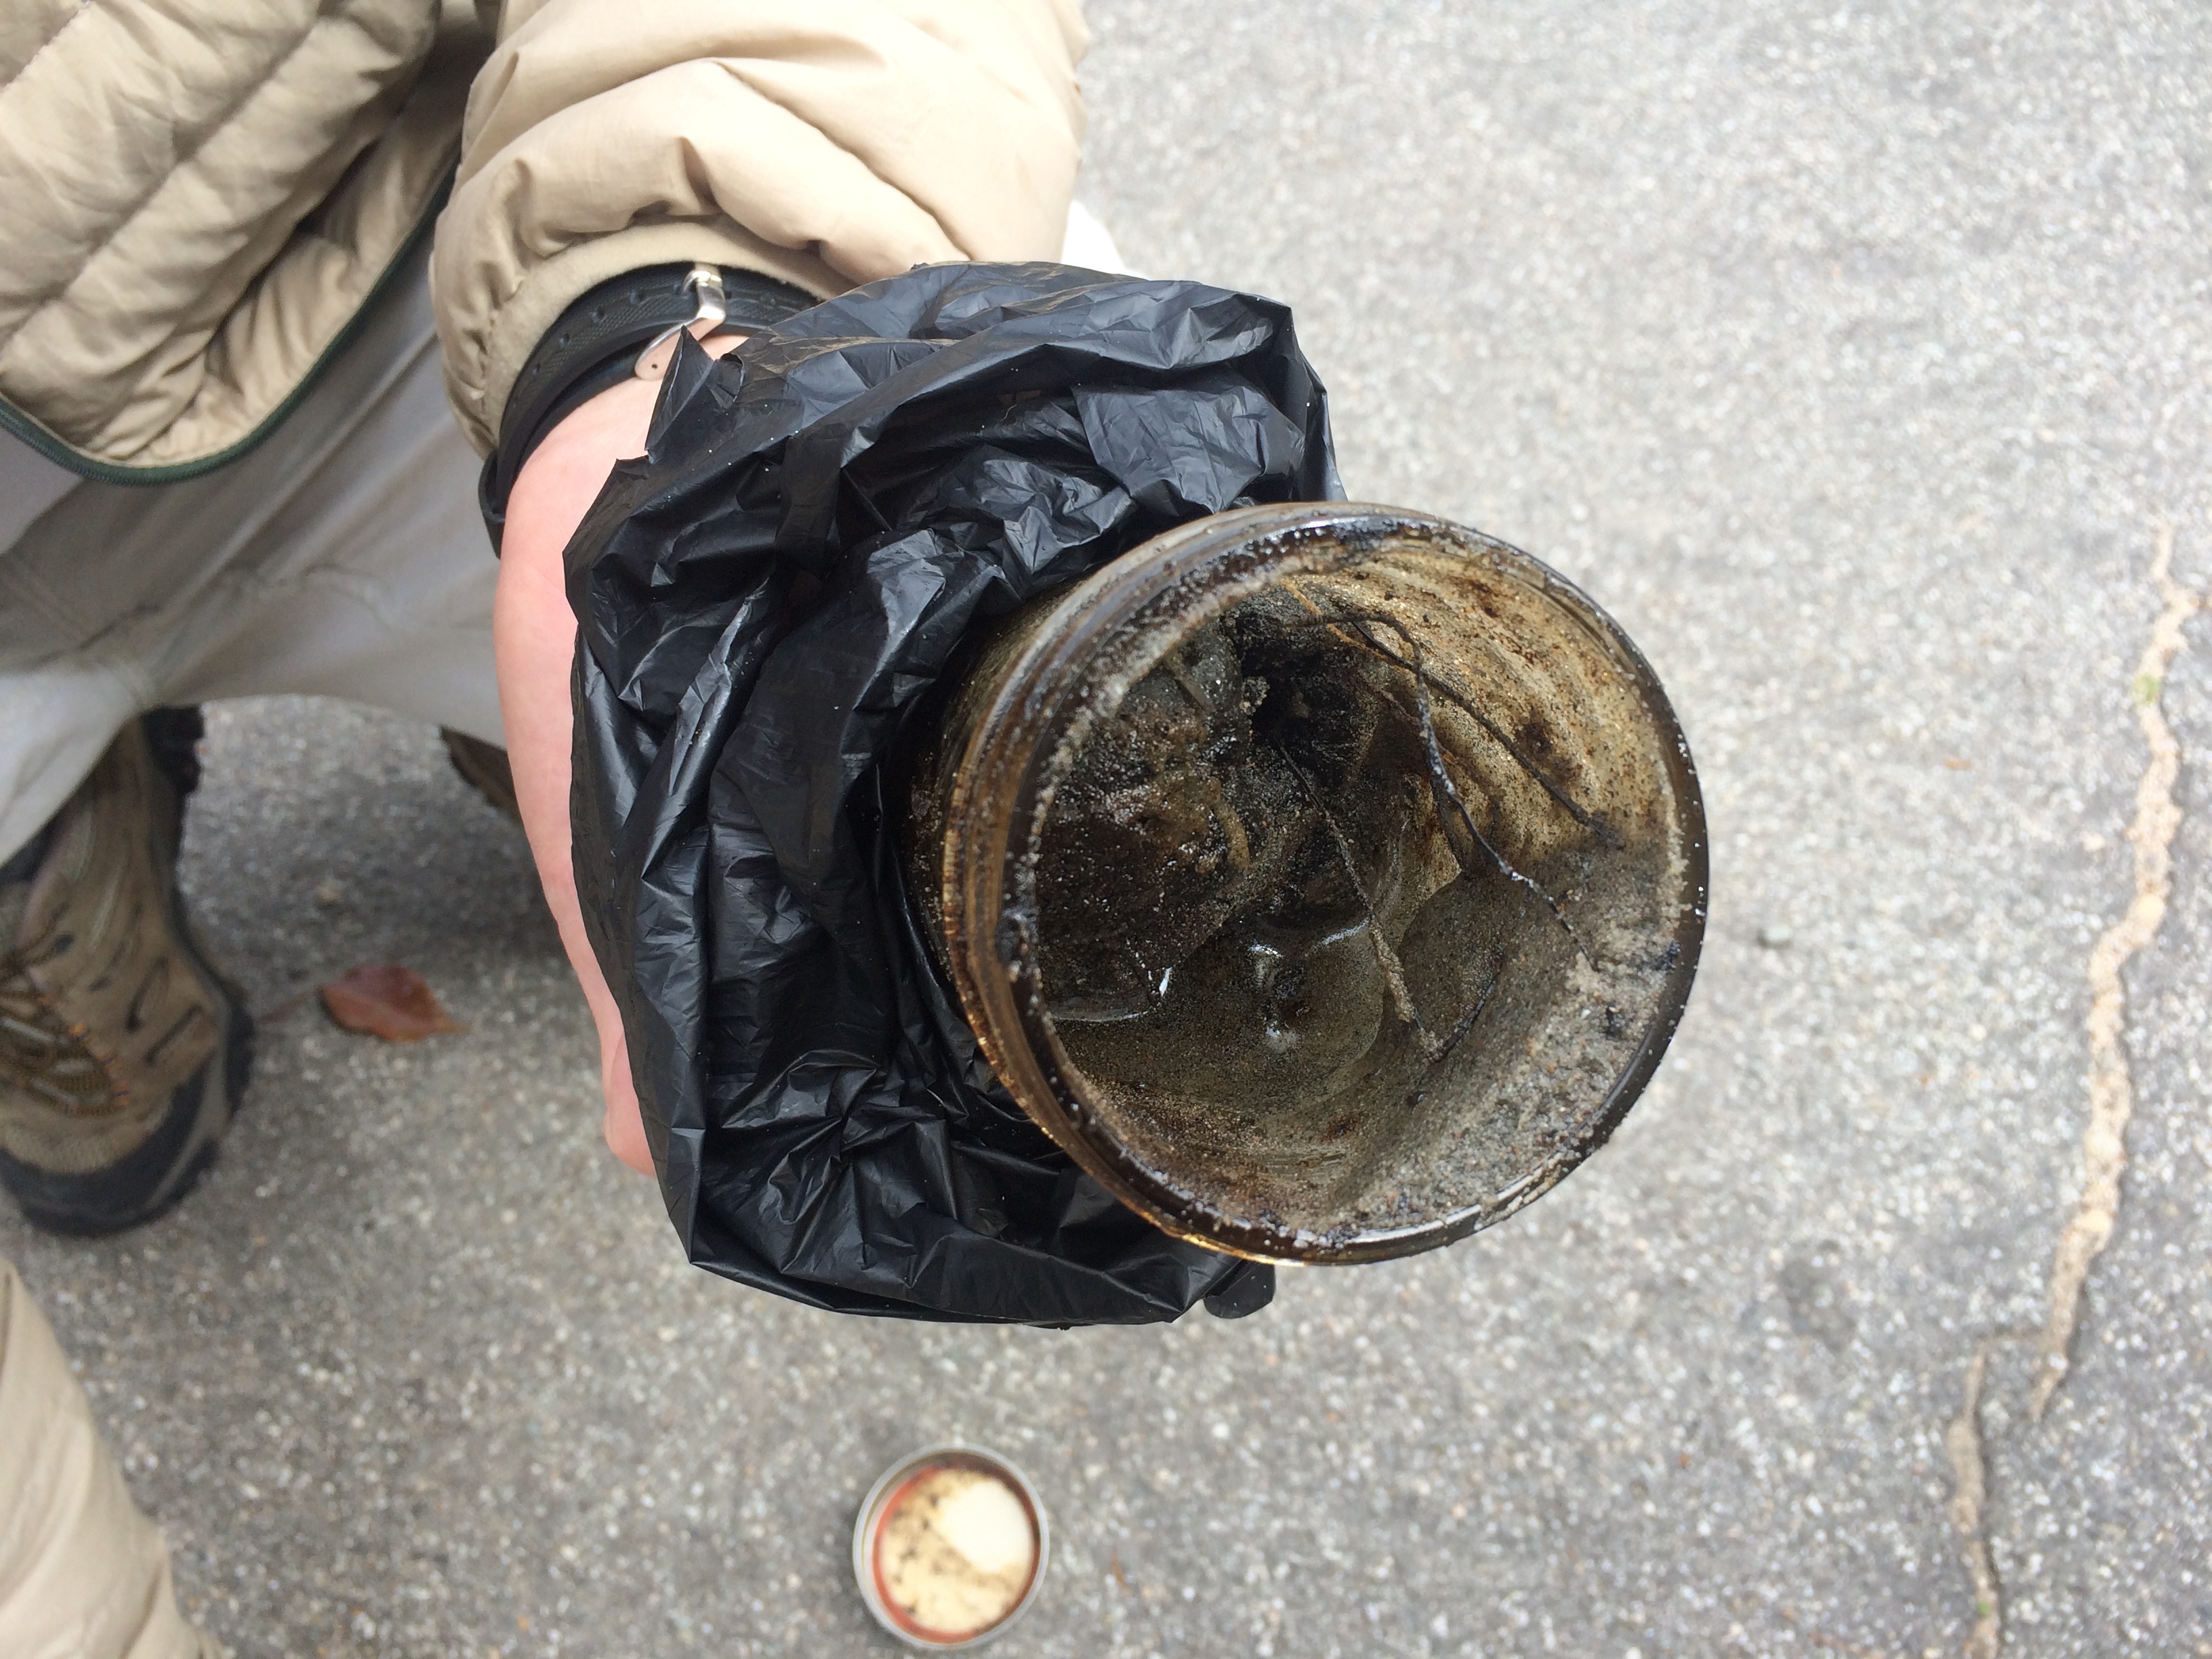
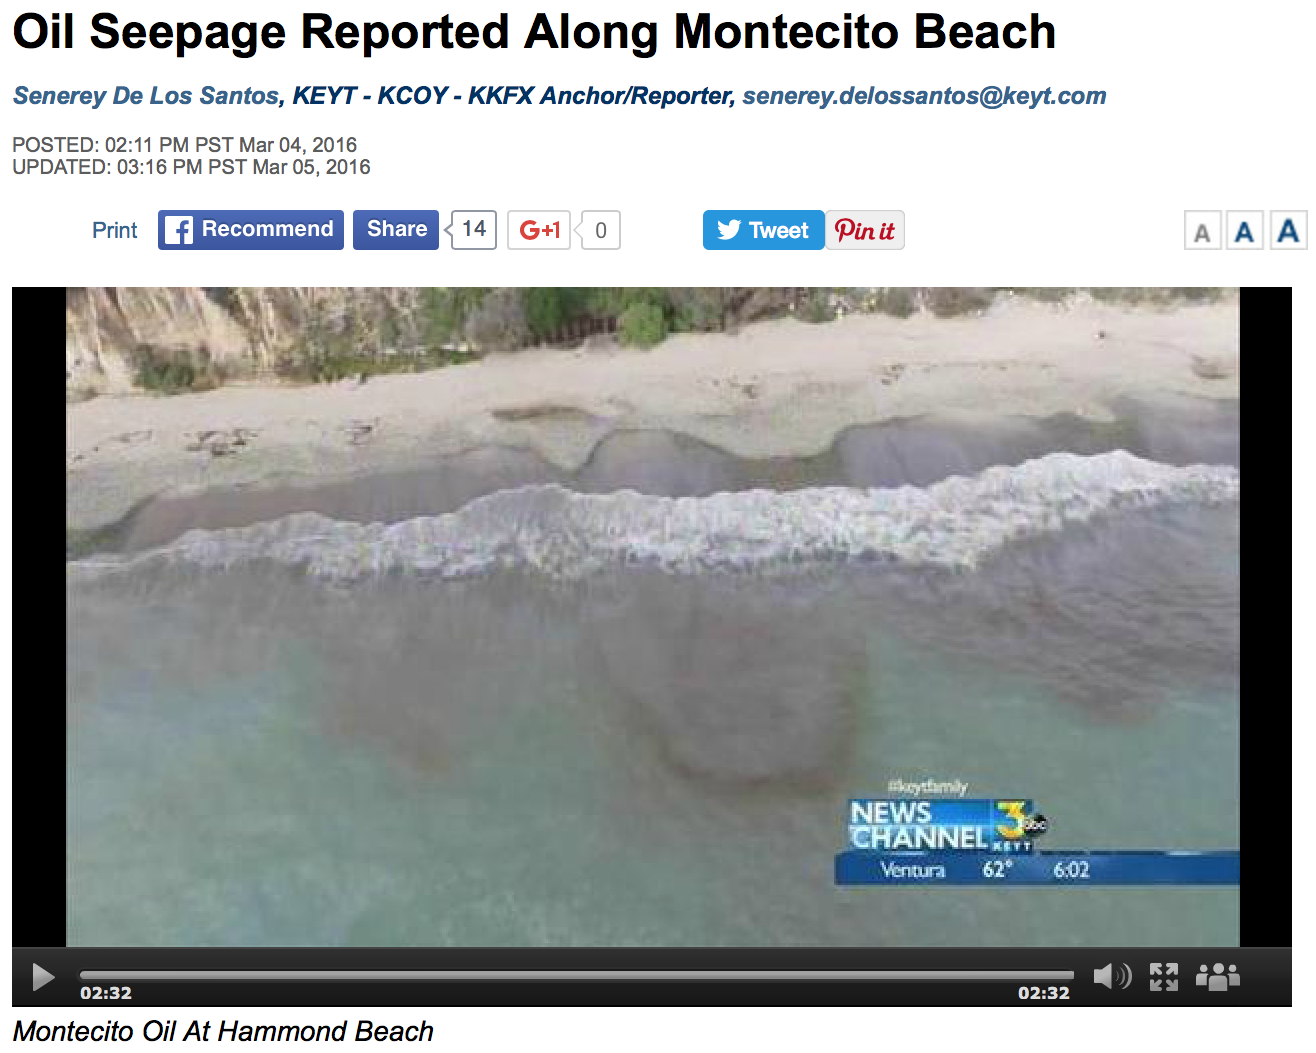
For the past several days we have been seeing unusually heavy oil deposition along the beaches in Summerland, centered just below Lookout Park. While we have been in a period of higher than normal seep activity for the past year or so, this tarring event seems beyond a mere seep event. This smacks of some type of oiling event from an (as of yet) unknown source, discrete or well bore.
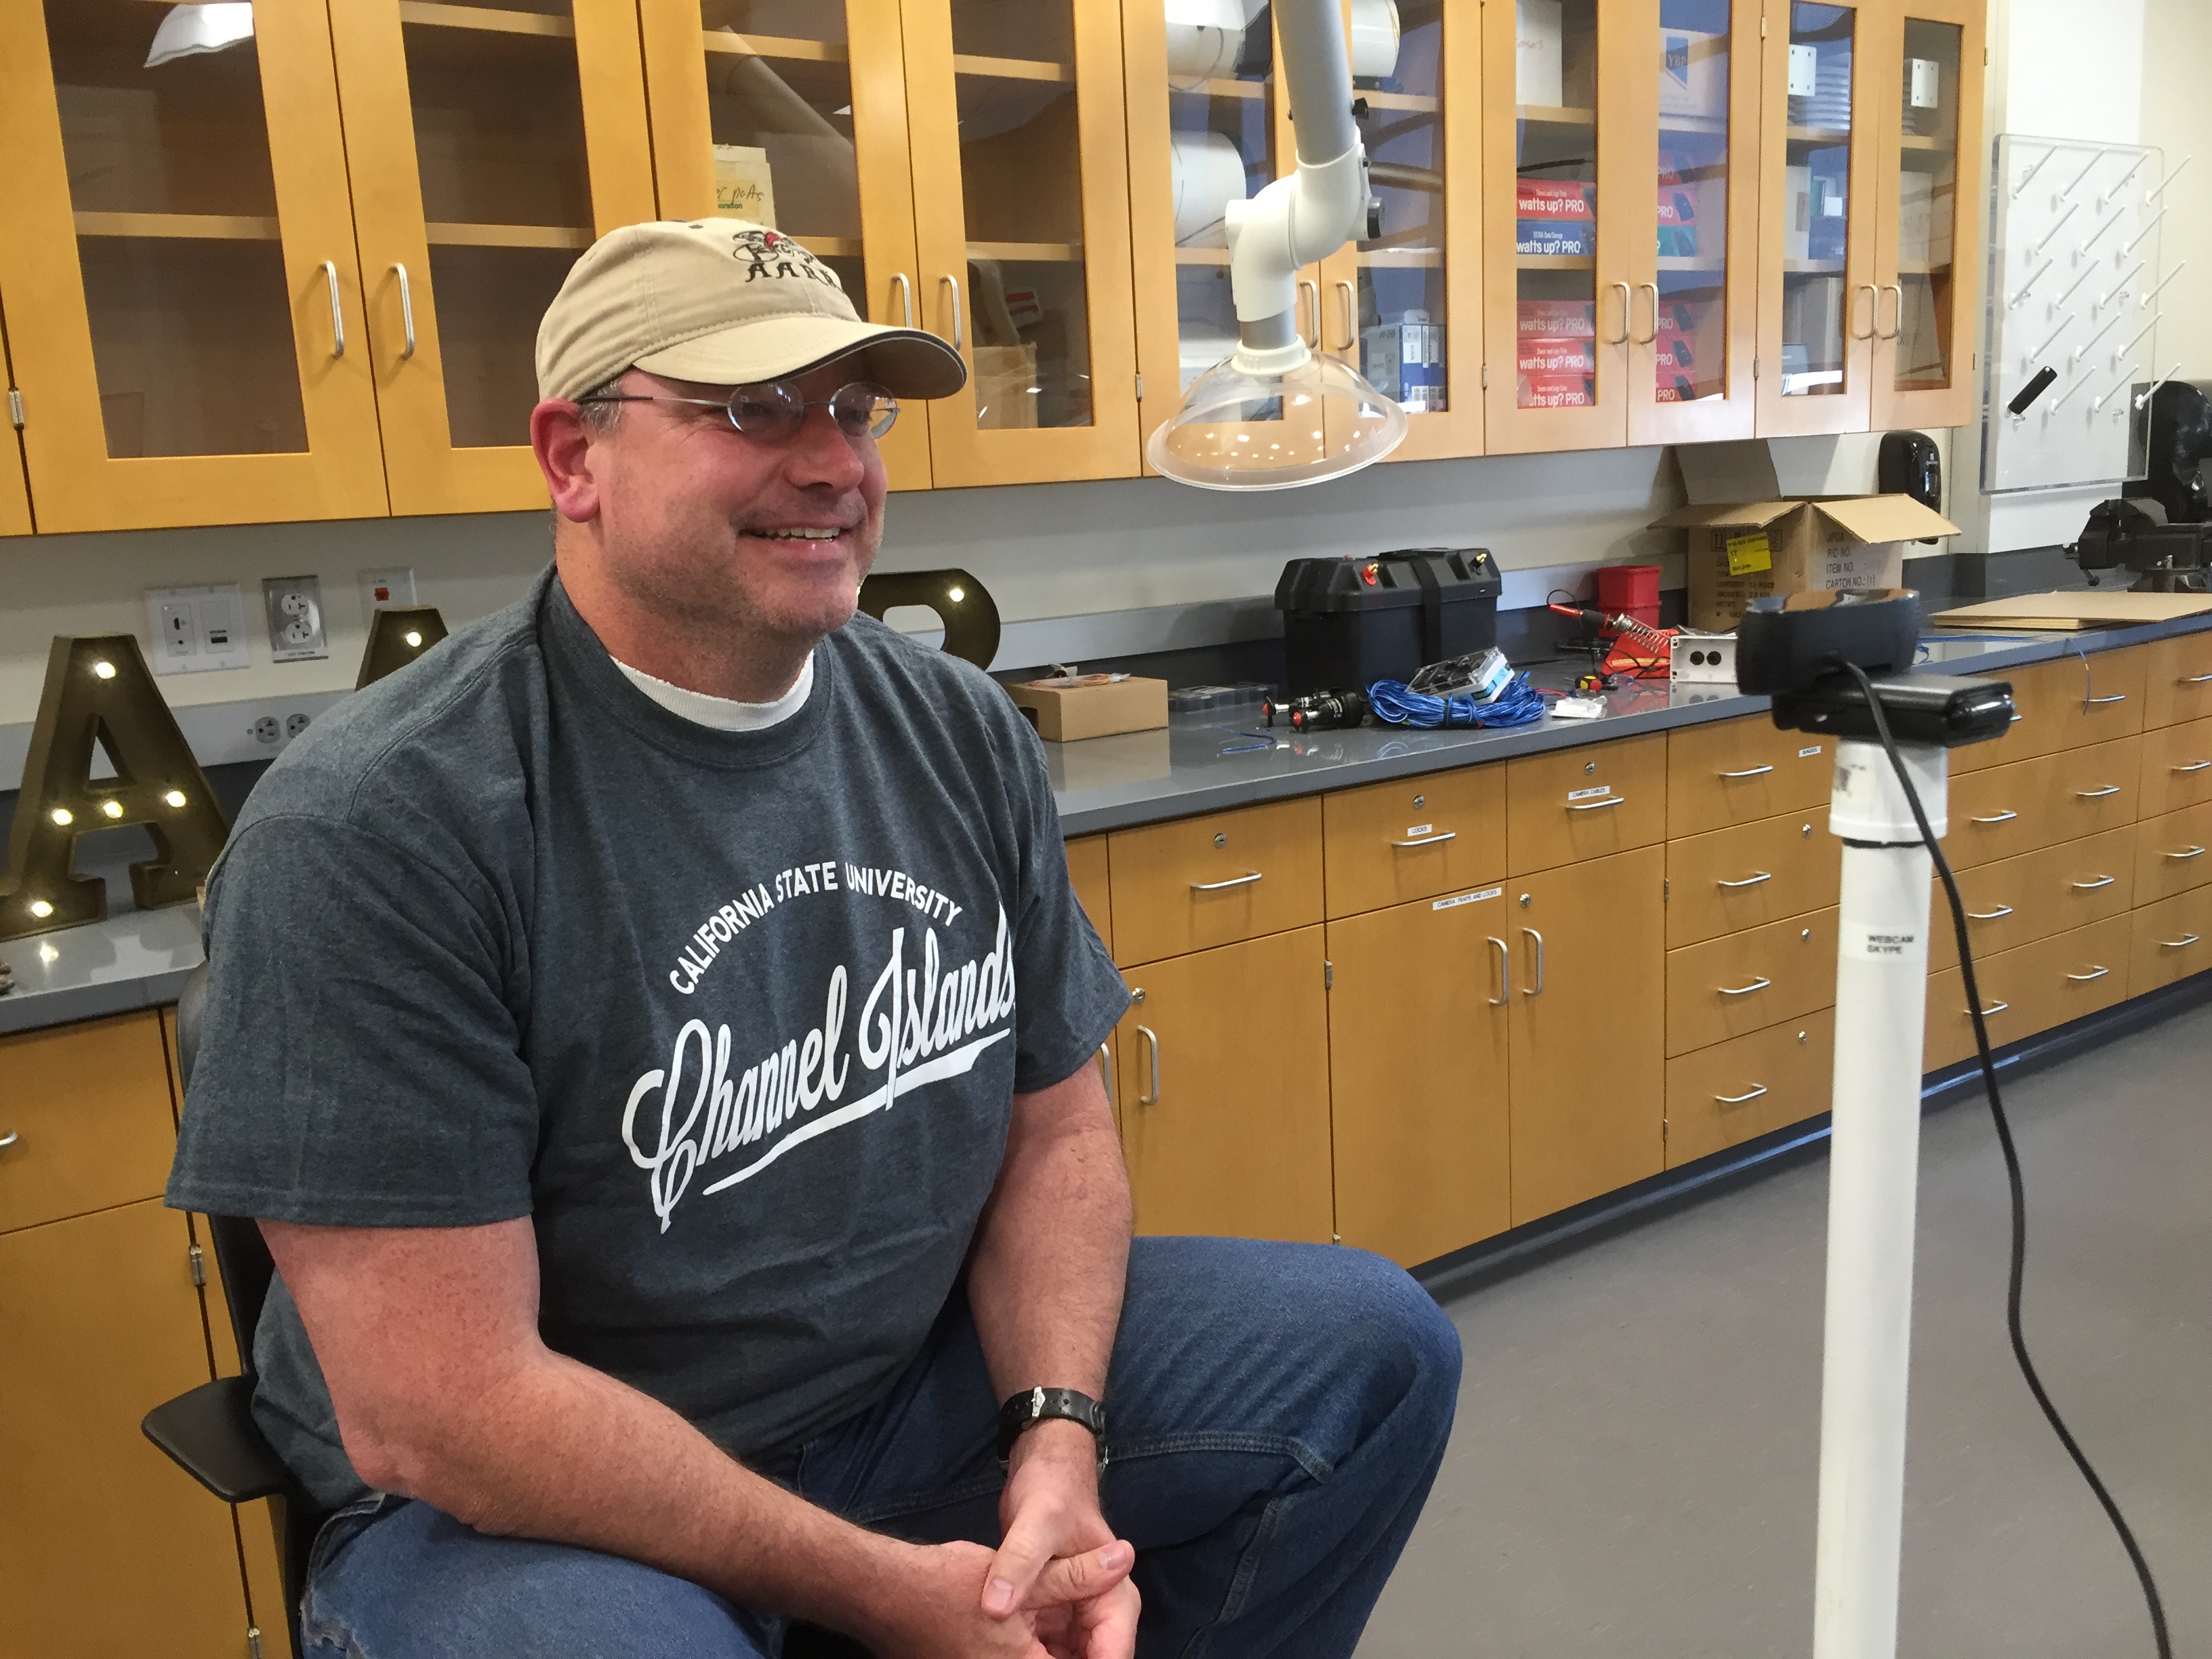
ESRM Tech Lab as Studio
In the midst of teaching my “Intro to Drones” class (ESRM 370) this past Friday, we got a ring from our local ABC affiliate, KEYT3 TV. They were looking for comment on this beach deposition, but my packed schedule was too full to arrange a regular interview on camera. Cue our new ESRM web camera and Skype. While Skype’s low-res connection didn’t do justice to that new HD camera, this was another example of the power of CSUCI and ESRM. Our interdisciplinary perspectives, community service orientation, and desire to communicate more widely motivated the purchase of that new camera a mere week before. On top of that, our brand-new, well-lit Tech Lab in Sierra Hall proved a convenient backdrop for an interview after our class wrapped up and before I had to run off to another meeting. Much thanks to Kim Gregory, CSUCI’s great Press Office, and AARR’s Tim Holcombe’s Skyping skills to get the whole hook-up in place while I was running between students and engagements.
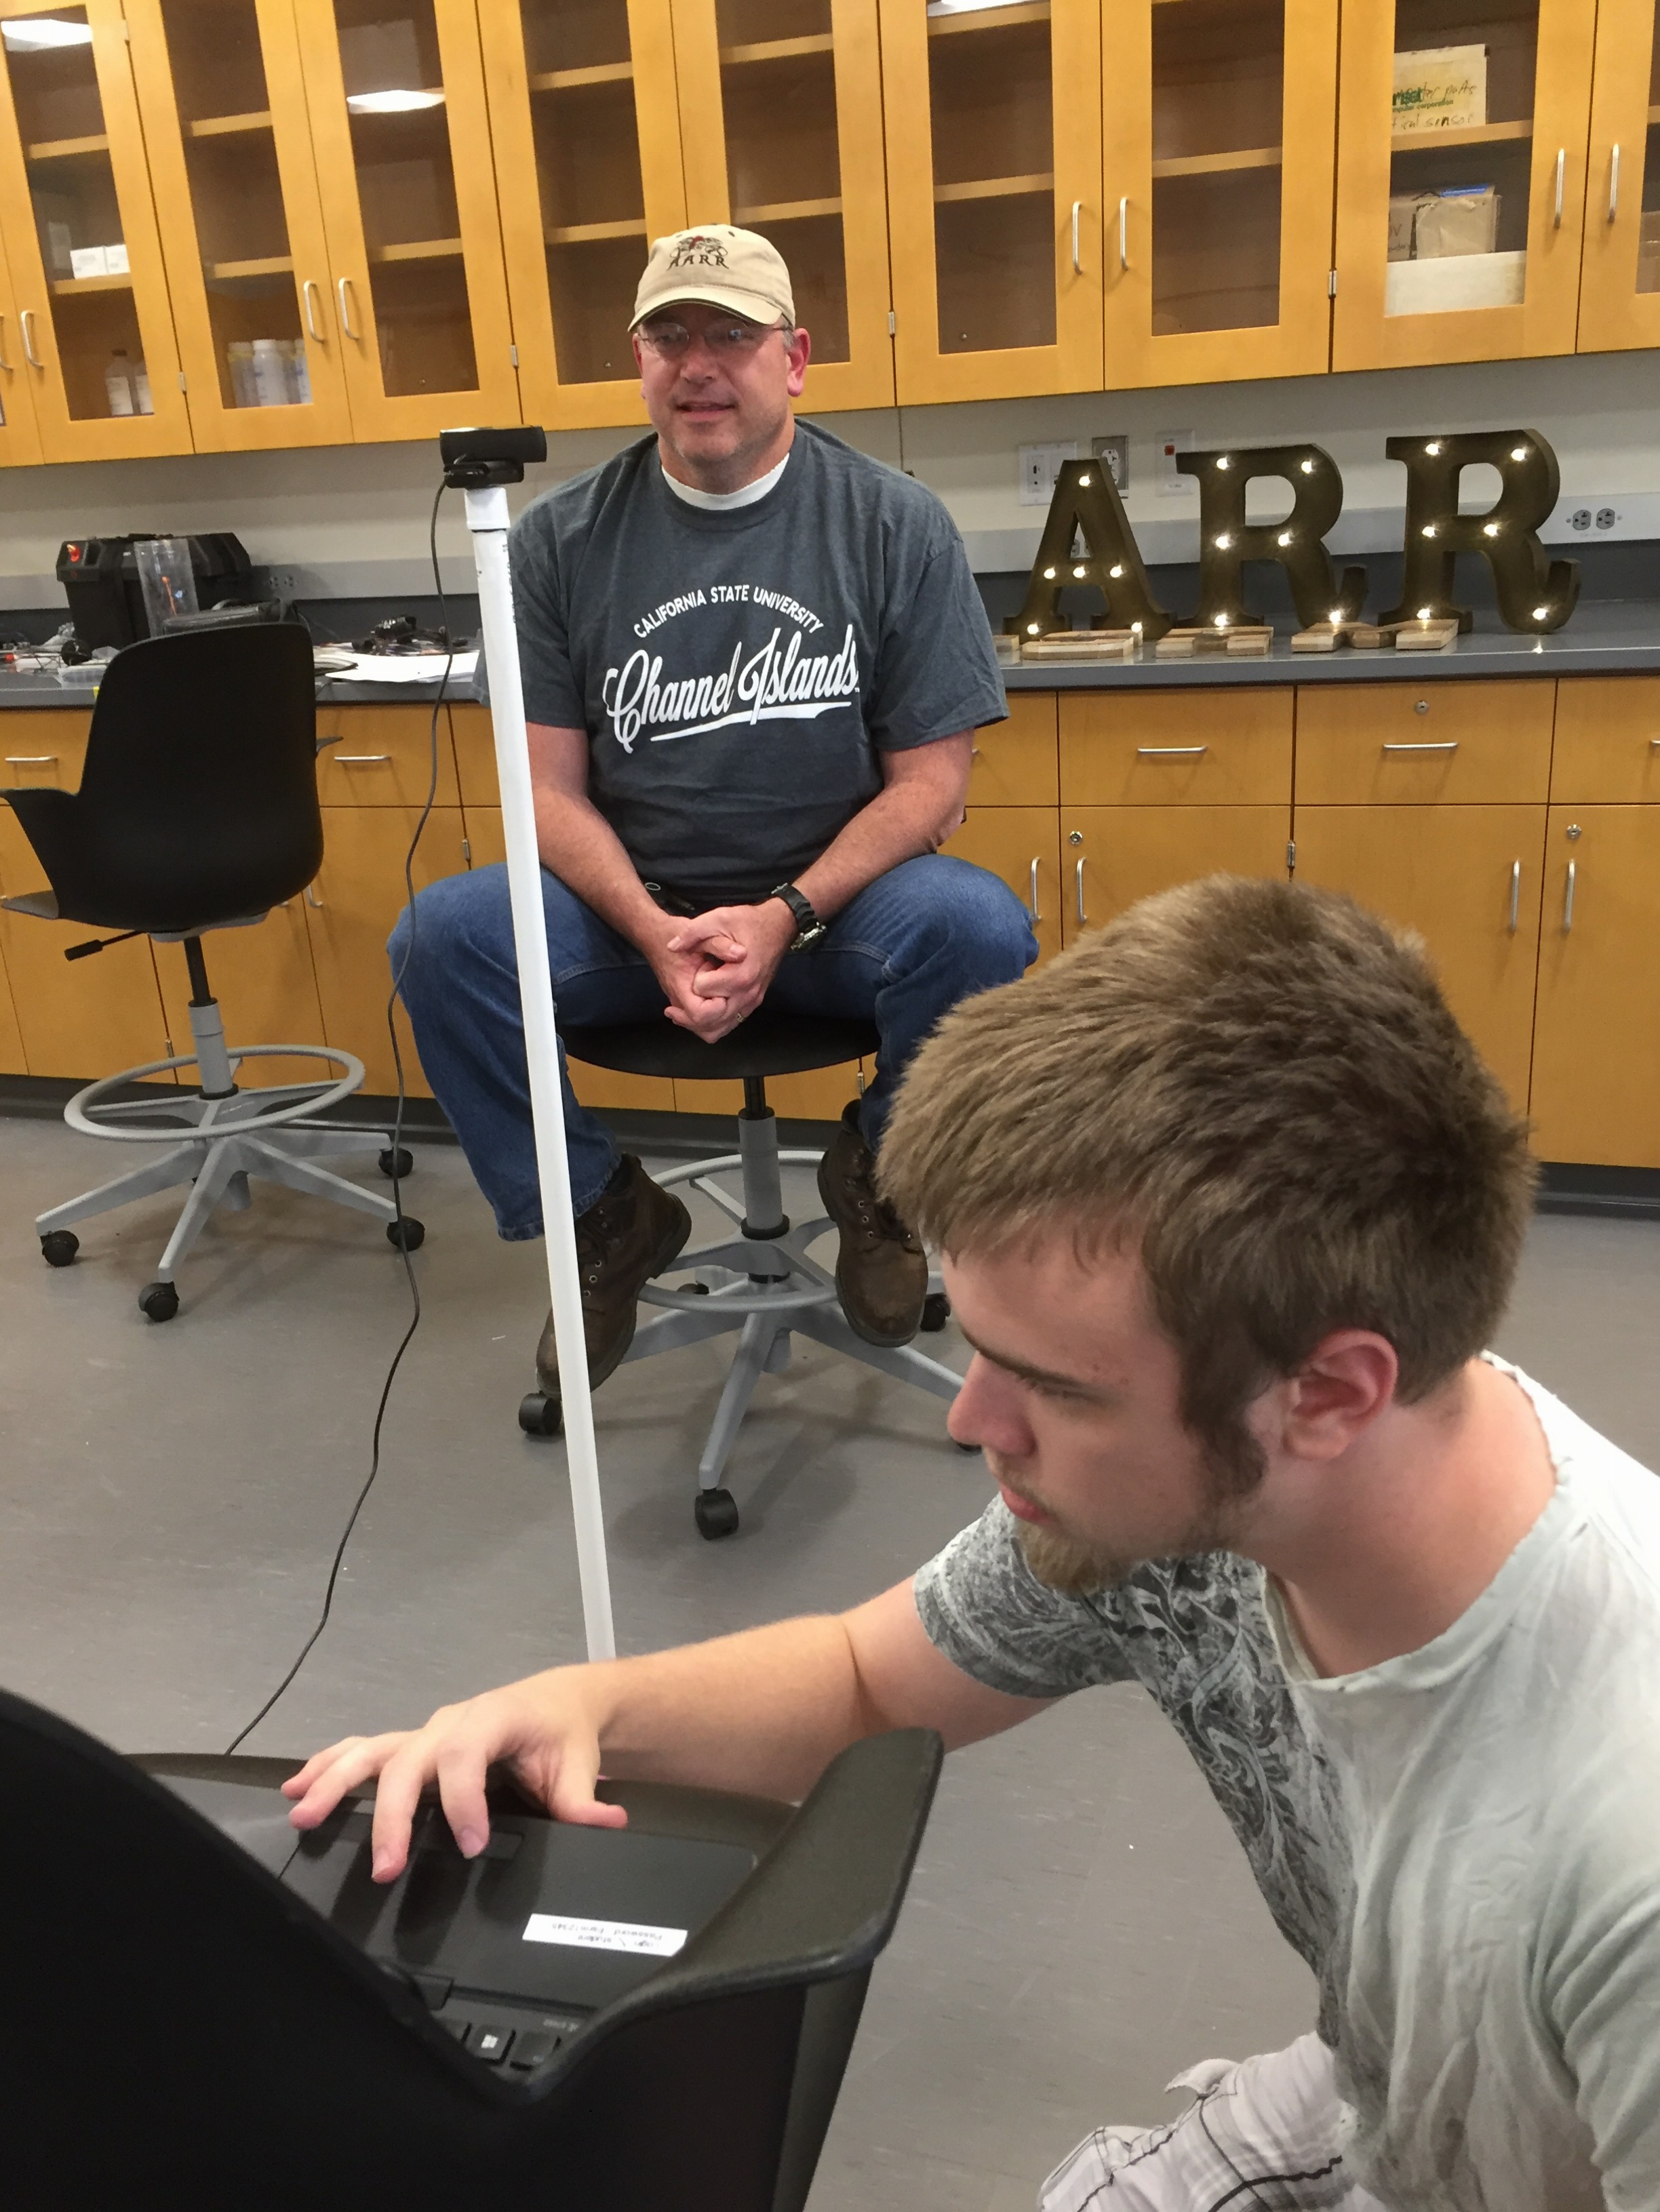
Tim on tech detail as we did a sound check before the questions flowed.
KEYT pulled together a brief, but nice piece in time for their 5 O-Clock news (below).
Becker Well
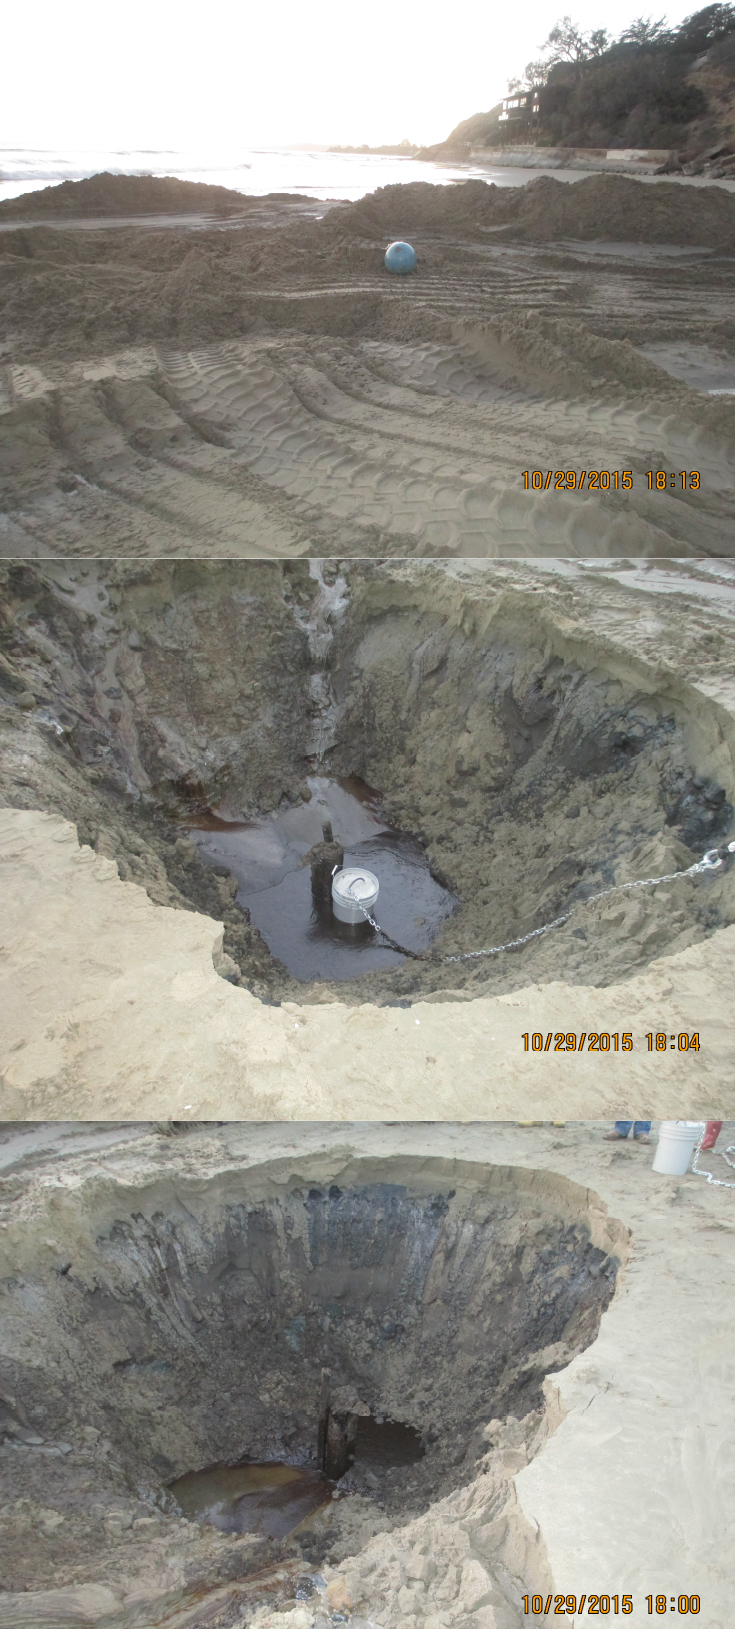
Many locals have been quite concerned for several years about potential releases from the Becker Well or similar such long-abandoned, but not necessarily properly capped, wells. The Becker Well was drilled sometime in the late 1800s, predating our modern suite of resource management agencies, modern environmental regulations, and even effective drilling records. Becker is in the surf zone. This appears to in part explain why it was never properly abandoned. It has a history of small but persistent oil leaks, apparently often being behind deposition onto the beach or into the nearshore ocean off Summerland’s coast. These ongoing drip-drip-drip of oil releases motivated the State Lands Commission to begin a re-excavation and attempt to reseal the well starting in late fall of 2015.
Images: State Lands Commission Press Release on November 2, 2015.
Over spring break, I will be traveling to Santa Rosa Island to finish collecting my data. I will be surveying my second watershed, Quemada Watershed. After the trip, my data set will be complete and ready for final analysis. During March, I will also be analyzing my current data set and prepare a poster for the AAG (American Association of Geographers) Conference. After the island trip, I will have a few days to finalize my poster. At the end of March, I will present in San Francisco for the conference.
https://cikeys.com/wp-content/uploads/2022/09/CI-Formal-Logo_2A-flat-300x50-1.jpg00Sean Andersonhttps://cikeys.com/wp-content/uploads/2022/09/CI-Formal-Logo_2A-flat-300x50-1.jpgSean Anderson2016-03-06 02:38:332016-03-06 02:38:33Plans for March
This past week, I was working on my results where I found that there is a decline in the Torrey pine population growth within the demography plots. It is quiet fascinating, in how Travis Hall and Andrew Brinkman found that the population was increasing with their data collection. Additionally, it will be interesting to see how this data will will correlate with the common garden experiment, which might shed some light on why there has been a decrease in the population growth.
TPSNR Torrey Pine Tree – These trees are to be much larger than the SRI Torrey pines.Premature TPSNR Torrey Pine Cones
https://cikeys.com/wp-content/uploads/2022/09/CI-Formal-Logo_2A-flat-300x50-1.jpg00Evangeline Forsterhttps://cikeys.com/wp-content/uploads/2022/09/CI-Formal-Logo_2A-flat-300x50-1.jpgEvangeline Forster2016-02-28 23:16:042016-02-28 23:16:04Results and Common Garden Update
This weekend I have been finishing up maps and extracting vegetation data by three slope categories (0-10%, 10-30%, 30-90%). The vegetation data was extracted from a 1993 map and the 2015 map to figure out the change for each cover type. The largest decrease in cover was found in annual and foothill grassland while the largest increase was in woody scrub (Lupine/Baccharis).
The most dramatic changes at Port Hueneme can be seen at Transect 1. The top photo taken in October had a beach length of 90 meters to the edge of the scarp. Currently (2/27/16), the beach is 5 meters to the edge of the scarp. As the sand is migrating south, more and more riprap is becoming exposed. I predict that within the next few months, Transect 1 will be completely underwater and unable to survey with the automatic level.