A few distinct, but unrelated experiences have brought the issue of plastic balloons in the ocean into frequent conversation this week.
Balloons trash our beaches. Image from BalloonsBlow.
Scorpion Cove Beach on the foggy early morning of September 18, 2016. This section of Santa Cruz Island is owned by Channel Islands National Park.
It began with last Saturday’s annual California Coastal Cleanup Day. I happened to be out on Santa Cruz Island with my son’s Boy Scout Troop. Our 30 scouts made quick work of the debris on this cobble beach, ultimately cleaning up just over 2.6 kg (5.6 lbs.) of garbage off the comparatively clean beach that afternoon. Our cleanup was one of nearly 1,000 such beaches targeted for cleanup by anti-trash volunteers across the Golden State. While we had a grand total of zero balloons recovered on that Santa Cruz Island survey, our Island Packers boat twice paused on our way out to the island earlier that morning to recover two separate balloons floating in the Santa Barbara Channel. Our cleanup, the boat recovery, and a microplastics beach demonstration I ran for our scouts later that weekend all drove a series of discussions of both plastics generally and balloons in particular.
Beach trash picked cleaned from Scorpion Cove on Santa Cruz Island, September 17, 2016. Weight totaled 2.6 kg (5.6 lbs). No balloons here, but this got everyone thinking…
The pervious week saw my wife order me into the waters off of Balboa Island to get a floating balloon because “that’s what you do.” And then two days ago came a call from the Ventura County Star’s Colleen Cason asking about balloons (who had been similarly motivated to think about balloons by a brief balloon-motivated detour on a trip out to the Channel Islands last weekend). Check out Colleen’s piece here.
As almost all of these recent balloon-in-the-sea conversations have me repeating the same things over and over, I suddenly realized a little summary for anyone interested in such party pollution might be in order.
Dead Black-footed Albatross entangled in latex balloons and cotton string on Zmudowski Beach, California. Image: C.Miller/P. Brown (BeachCOMBERS).
Types of Balloons
Most of the balloons we encounter in our daily lives fall into one of two categories:
Latex balloons are created from rubber. That rubber can be either synthetic (created from polymerizing a monomer such as isoprene, generally deprived from natural gas or crude oil) or natural (milked from trees of the genus Hevea, a Euphorb). The traditional term “India rubber” refers to natural latex harvested from Hevea trees, especially the Pará rubber tree (Hevea brasiliensis). Even “natural” latex is usually altered chemically before being turned into commercial rubber balloon fodder. Most often this treatment is via a vulcanization process (i.e. curing) wherein that natural latex is baked to crosslink the existing polymer with additional compounds (most typically sulphur) and in so doing alter some of the compound’s chemical properties. In the case of balloons, this vulcanization serves to make the rubber smoother, more pliable, and less sticky. Latex rubber balloons break down comparatively quickly in the environment, especially when that rubber is thin-walled and exposed to prolonged, strong sunlight/UV and high heat such as under a midday summer sun.
Mylar
“Mylar” is a trade name for metal-coated poly(ethylene terephthalate) or PET, created for NASA’s space program. Metalized PET was first used by NASA in their 1964 Echo II balloon satellite project. Most of our current commercial balloons are actually made of Biaxially-oriented polyethylene terephthalate (BoPET), a polyester film made from stretching PET. The BoPET is covered on one site with polyethylene for improve puncture resistance and on the other by aluminum (or another metal) for a maximally reflective surface. These coverings also allow the balloons to be heat sealed (something not possible with “pure” PET itself). These coatings act to make the material stronger and more durable, but consequently harder to break down once their short product lifespan is over. In such discussions of balloons by the less chemically or industry savvy, you will find “Mylar,” “polyethylene,” “PET,” and “foil balloon” used more or less interchangeably. In addition to Mylar, Melinex and Hostaphan are other common trade names you might see for equivalent materials.
How does this Mylar Stuff go away?
“Away” is always a relative term. Philosophical musings aside, a better question might be “How do plastic balloons decompose?”
Mylar is one type of plastic. And most of our modern plastics are essentially long chains of repeating carbon (what chemists call “organic”) molecules. We “decompose” plastic by both breaking up those long, repeating chemical chains and by chemically turning those building blocks into some other compound. We have essentially four options to do that:
photodegradation
Alteration of the plastic material via exposure to light, especially UV light.
thermo oxidative degradation
Alteration of the plastic material via heating up the plastic in the presence of oxygen.
hydrolytic degradation
Alteration of the plastic material via heating up the plastic in the presence water.
biodegradation
Alteration of the plastic material via feeding the plastic to microbes capable of eating carbon scaffolding and dealing with the various reactive chemical groups.
Degradation in the ocean
Consistently, the next question I’ll get asked is “how long does it take to break down Mylar.” And I always disappoint with the classically annoying professorial retort “it depends.” In reality some in the plastics industry would have you believe that Mylar simply “breaks down” quickly. Unfortunately, this is a very slow process in practice. Much slower than the break down of latex, for example. In practice pure PET will probably take at least many months to a year or more to start significantly falling apart, albeit yellowing and an increase in brittleness can being within minutes of exposure to strong sunlight. In practice the coatings, especially the metalized outer surface, act to shield the inner core plastic. Add to that these balloons are in the ocean where water temperature acts as a thermal insulator keeping the plastic from ever getting as hot as it otherwise would. Again that metal foils (sorry, too good an opportunity for a pun) microbial activity as well by shielding the internal “tasty” plastic from the microbes most able to eat and subsequently degrade it.
On the positive side, the balloon material will be exposed to potentially elevated physical trauma if the ocean is choppy or the balloon is being bashed into the intertidal. But again, this will act to breakup the aggregate balloon into small pieces, but not chemically transform it per se.
What should we do with our Mylar waste?
Ultimately synthetic plastics such as Mylar have few responsible fates, with the best course to minimize the production/use of the material in the first place. But as we seem to love our Mylar, I have ranked the possible fates in order from least to most preferable.
Contaminate our planet
Obviously a horrible idea. The vast majority of released balloons ultimately end up in waterways and the global ocean. See my section on risks below.
Burning
Combusting materials definitely gets rid of the physical mass, but this merely converts a solid waste problem into a gaseous waste problem. In the process you typically generate things none of us should be breathing.
Landfill
The most common, “least bad” of the poor alternatives. This is just what it sounds like.
Recycle
Properly collected plastics can occasionally be recycled, assuming a local waste collector has the proper fiscal incentives and technology. Most of the guides out there rapidly default to talking about the PET core of Mylar and note that regular PET is recyclable. But recall our Mylar is PET plus other stuff (especially that dang metal coating). When it comes to recycling (and particularly when it comes to recycling of low profit margin items like plastic), contaminants are the key consideration. When the material supply is homogeneous, recycling proceeds quickly and yields a high quality ending material that can reenter the production cycle for yet another life. But with each impurity the technical and chemical challenge grows and the meager profits shrink. In practice most sources seem to quickly segway into discussions of repurposing or down cycling Mylar balloons. For example, Recycle Scene suggests getting crafty and using old Mylar balloons for bird deterring flash strips.
What risks do floating balloons pose?
Initially we are talking about threats from the physical structure of the ballon (entanglement and ingestion). We have little direct evidence of acute or chronic toxicity of this plastic to individuals post-ingestion, but the ubiquity of this material and sheer additional volume entering the seas daily make this an increasingly likely potential impact. My colleagues and I as well as labs across the planet are actively working on this now (California is becoming something of a hotbed for marine debris research). Stay tuned for more info on that story.
Entanglement
Essentially anything can get potentially get entangled by a flotsam balloon. Most commonly we hear of larger animals such as seals and sea lions bound with plastic, but this is a risk to any oceanic creature (NOAA documents 200 species). I have occasionally seen balloons and/or functionally similar plastic bag waste wrapped in kelp canopies, gorgonian fans, and coral heads, showing sessile organisms are impacted by this waste as are the more conspicuous mobile critters.
Essentially here we are talking about floating objects that can occasionally resemble jellyfish. The organisms that ingest jellies are most at risk here; sea turtles, ocean sunfish (Mola mola), and the like. Other critters will occasionally ingest them (e.g. tuna) or attempt to use them as structural elements (e.g. albatross nests). When ingested, balloons can obstruct digestive tracts and pose a great risk to the animal in question of a painful, drawn out death via starvation.
Fragments of a blue latex balloon found in the stomach of green turtle stranded dead near Blackpool, UK. Image: Rod Penrose, Marine Environmental Monitoring, UK CSIP.
Are oceanic balloons a big problem?
Not exactly. Our most recent surveys of Channel Island and California mainland beaches (Miller, et al. 2016) show latex and mylar balloons combined total a mere 0.01% of the total weight of material washing onto our southern California beaches. So the problem of balloons in the sea is not that big in relative terms. Yes there are (literally) tons of balloons washing into or landing upon the surface of our seas daily, but that ultimately pales in significance to the many orders of magnitude greater stream of waste entering our ocean, much of which is plastic.
So we shouldn’t care about balloons?
No way! We should indeed care about these items!
Balloons are fantastic “gateway plastics” that provide a perfect starting point for educating the general public about our plastic-based consumer culture generally and marine debris in particular. We all know exactly what a ballon is, where it came from and how it was used. Additionally, the high visibility, shiny metallic surface of a Mylar balloon floating on the surface of the ocean is much more readily detectable than the more numerous, problematic, and ubiquitous microfibers floating through our waters or clear plastic bags floating just subsurface. Each balloon we pick up is a teaching opportunity. An example to learn about plastic and a opportunity to educate yourself about non-ballon alternatives (try surfing on over to the BalloonsBlow, for example).
Importantly, balloon waste is also something clearly within our wheelhouse. It is all too easy to blame some amorphous greedy industry polluter or faceless profiteer for our waste stream. But who is to blame for the ballon that says “Happy 5th Birthday Sally?” That would be you and me. Change always starts in the mirror. And Mylar balloons are a pretty damn shiny surface.
Additional References:
A few links to some of our ongoing research into plastic pollution:
Michaela Miller’s ESRM Capstone research on marine debris (2016).
Popular press articles about our collective work on plastics:
A now more than 12 alarm fire erupted within the past hour in Ojai, California (in western Ventura County). The incident was reported at 8:35 a.m. near Highway 150 and Topa Lane roughly here ( 34.438417°, -119.132719°): The incident was originally thought to be a burning oil derrick, but subsequent reports have clarified that it is instead a more vertical storage tank that is aflame. The Ventura County Star is reported it to be a 1,762 gallon holding tank at 9:20:
Fire crews battled a petroleum fire outside Ojai Friday, authorities said. The blaze was reported at 8:35 a.m. near Highway 150 and Topa Lane near Ojai, officials said. Officials reported a tank holding approximately 1,762 gallons of petroleum was on fire. Crews at the scene reported the tank was in danger of collapse. Authorities also reported an explosion had occurred at the scene. Authorities said multiple workers required medical attention due to exposure. The blaze threatened brush in the area, officials said. More than 12 units responded to the incident, according to fire officials. Luckily this happened very close to Ventura County Fire Department’s Station 20!
Apparently several people are injured and needed medical evacuation. Concern at the moment is on both containment of the flames, associated air toxicity, and preventing the fire from spreading to the adjacent scrublands already tinder-dry in year four of our state-wide drought (for context see this morning’s LA Times story on the numerous state-wide fires now engulfing California). Of additional concern in the wake of the immediate knocking down of the flames will be mobilization of burned and unburned oil and oil slurry offsite or into the surrounding soil via the hosewater and suppressants. Our Ventura County Fire Department rocks and they will do everything they can to both stop the flames and minimize impacts from the oil, but there is only so much you can do. Oil fires can be difficult beasts. Video via VC Star. I will update this post throughout the day when new developments arise and details are made available. Update August 5, 2016 At 10:13: KEYT’s coverage is here, but no new details. ABC7 has an aerial photo:
THIS JUST IN: Ventura County firefighters working on oil tank fire in Ojai, worried it could spread to nearby brush pic.twitter.com/K25jnVW3OT
Ventura Avenue Field in 1928, one of America’s greatest petroleum strikes at the time. Image: Museum of Ventura County.
In reference to some comments I have see: yes, Ventura County’s “back country” has been the epicenter for oil extraction for more than a century. See for example: Drilling down into Ventura’s history from the VC Star and
Updated injury report shows two workers were injured in the initial blast/ignition. Fire crews on scene are letting the tank burn down while monitoring the surrounding area to assure the fire will not spread from the immediate tank area itself. Om addition the incident may now have a formal name: the Topa Fire.
Thankfully in now appears the 5,000 gallon oil storage tank only had an estimated 1,800 gallons of crude in it at the time of the initial explosion.
The roughly 5 m (15 ft.) high and 3 m (10 ft.) diameter vertically-oriented tank is still intact according to the midday news images and video of the site. This is good news and increases the chance we will get through this with a significant surface spill.
Fire officials are still apparently trying to track down the actual owner of the oil, with some outlets noting that the site has apparently been leased to an as yet undisclosed operator who presumably owns/controls that oil.
https://cikeys.com/wp-content/uploads/2022/09/CI-Formal-Logo_2A-flat-300x50-1.jpg00Sean Andersonhttps://cikeys.com/wp-content/uploads/2022/09/CI-Formal-Logo_2A-flat-300x50-1.jpgSean Anderson2016-08-05 17:05:102016-08-05 17:05:10Ojai Oil Tank On Fire
Every two years the Olympic Games roll around and we are treated to endless commentary and an amazingly small amount of actual sport (at least on NBC Universal Channels that have a stranglehold on U.S. broadcasts via their $7.75 billion contract). Outside of the NBC hype machine, we have seen a pattern in recent years of news stories critiquing almost every aspect of the host city’s Olympic endeavor in the lead-up to the opening ceremonies. From exposés on the displacement of marginalized peoples for new infrastructure to massive budget overruns to illegal and institutionalized drug doping by athletes, these investigations often question the logic and raison d’être of the entire Olympic endeavor. Of particular interest is the rising sub-genre of environmental quality reporting generally focused on athlete-relevant or visiting reporter-relevant environmental quality (see for example what happened in Beijing and Sochi). Rarely do these concerns survive the lighting of the Olympic Flame. But this year might be different. This year we have data. Lots and lots of environmental quality data. And it paints a pretty disappointing picture.
Rio de Janeiro’s aquatic Olympic venues. Figure: The Washington Post in 2015.
Coastal Brazil incarnate. Rio de Janeiro’s Guanabara Bay and Sugarloaf Mountain. Image: Medium.
Everyone knew the coastal and inland waters were bad, with Guanabara Bay the epicenter of concern for the 2016 Olympics. At the time the Brazilian government committed to “regenerate Rio’s magnificent waterways” via new, permanent sanitary infrastructure. The much-lauded, maverick billionare businessman Eike Batista pledged some of his then-immense personal fortune for both some of the initial cleaning and to help jumpstart those associated improvements. Later this morphed into a consortium of the Dutch government, several Brazilian and international environmental NGOs, and various other Rio business interests proposing holistic solutions to Guanabara Bay’s pollution. It was very heady stuff. Their solution would eventually morph into the Clean Urban Delta Initiative and span an array of more than 20 sub-plans, each with more narrowly targeted outcomes ranging from temporary skimming of floating plastic to the installation of treatment wetlands sized to clean those waste streams prior to their discharge into the ocean.
But that was a long time ago. And then, you know. Reality set in.
All of this translates into a tempest of distraction for those hoping to improve the fetid coastal environment of Rio’s shores. There has simply been no bandwidth or fiscal wherewithal to resolve these issues. Environmental concerns have become a very low priority for local, state, and federal authorities alike. The Mayor of Rio is out of money, the state and federal governments are paralyzed by the scandal, and that billionaire who ranked as the eighth richest person in the world in 2012 is broke and being prosecuted for numerous counts of insider trading (his net worth may be into the NEGATIVE billions of dollars at least check).
Rio de Janeiro: 2016’s Olympic Home
Copacabana Beach in a rare people-free moment. Image: Adam Jones.
This coastal city’s most recognized landmarks include the Christ the Redeemer statue towering high above the cityscape and the iconic sandy beaches of Copacabana and Ipanema. But the more significant landscape element for our story today is the massive human population at the heart of this megacity. Rio de Janeiro’s roughly 6.5 million residents make it the second most populous city in Brazil and sixth largest in the Americas. More than one-fifth (1.4 million) of these residents reside within the network of flavelas sprinkled across the hillsides and former wetlands buffering the urban core. And the problem isn’t merely a favela issue; a 2015 survey reported 3.6 million people across 100 Brazilian cities lacked even rudimentary connections to sewer systems. These haphazard, unplanned shanty towns have little to no functioning municipal sewage systems, with most dumping raw sewage into the waterways that in turn dump into ocean. This waste stream compounds the already horrible state of waste collection and treatment across the city. Amongst other things, this has produced a massive coastal water quality crisis whose growth paralleled the rise of this recently-robust economy.
The day before the opening ceremony, Rio’s coastal waters are not the kind of places you want your kids splashing about in. Rather they are ripe with “raw” human waste, garbage, human viruses and fecal indicator bacteria, according to a 16-month-long Associated Press study widely circulated last week.
The AP ran simple coliform and DNA/RNA Virus Mini Kit assays as well are more sophisticated viral counts and quantitative PCR at various olympic and paraolympic venues hosting rowing, kayaking, canoeing, sailing, and (gulp!) open water swimming. These methods gave them the basic “quick and dirty” water quality parameters that are pretty standard across most of the world, with generally accepted critical points for health concerns and management triggers.
AP’s Rio water quality testing locations in the lead-up to the 2016 Summer Olympic Games.
In brief, the fractured and half-hearted Brazilian attempts at infrastructure improvement and pollution abatement have come home to roost. For example, most of the 17 pollution screening efforts are fractured and ineffectual, sewage treatment plants are operating well below their operating capacity with plants not even necessarily plumbed into the sewage system, and then there are the dead bodies just dropped on the beaches (where everyone gets to play volleyball in a week). Brazilian TV reported that about 8,200 liters of untreated sewage flow into Guanabara Bay EACH SECOND. Merged with that AP data, this means ingesting three teaspoons of bay water would produce a “99 %” chance of infection. The Atlanticreported back in in March7 to 9% of sailors were getting sick while practicing in the Bay, a rate that the International Sailing Federation has argued is acceptable (but exceeds the U.S. EPA maximum illness rate for swimming, 3.6%).
Rio’s Olympic Water Quality
site
date
human adenovirus (min) genome copies/liter
date
human adenovirus (max) genome copies/liter
date
fecal coliform bacteria (min) MPN/100 ml
date
fecal coliform bacteria (max) MPN/100 ml
Point 1. Marina da Gloria
Sep 2015
343,000
Jun 2015
127,000,000
various
not tested?
various
not tested?
Point 2. Marina da Gloria
Mar 2015
3,230
Jun 2015
533,000,000
Mar 2016
24,196
Dec 2015
68,000
Point 3. Rodrigo de Freitas Lagoon
Sep 2015
372,000
Mar 2015
1,730,000,000
Apr 2015
19,863
Sep 2015
41,066
Point 4. Rodrigo de Freitas Lagoon
Feb 2016
36,600
Mar 2015
956,000,000
Apr 2015
24,000
Sep 2015
36,540
Point 5. Copacabana Beach
May 2016
842,000
May 2016
414,000,000
various
no detection
Feb 2016
4,860
Point 6. Ipanema Beach
Aug 2015
0
Jun 2016
33,500,000
various
no detection
Aug 2015
19,863
Point 7. offshore inside Sugarloaf sailing course in the Guanabara Bay
May 2016
932,000
Nov 2015
85,300,000
various
no detection
Aug 2015
19,836
Point 8. offshore inside the naval school sailing course in Guanabara Bay
Apr 2016
1,130,000
Aug 2015
34,800,000
various
no detection
May 2016
17,329
Point 9. offshore in the Rodrigo de Freitas Lagoon
May 2015
801,000
Jun 2016
331,000,000
various
no detection
Sep 2015
3,150
Point 10. The Quebra-Mar area of the Barra da Tijuca beach
Mar 2016
0
May 2016
101,000,000
various
no detection
May 2016
24,196
Point 11. Barra da Tijuca Beach in front of Sheraton Hotel
Mar 2016
0
May 2016
87,600,000
various
no detection
May 2016
3,555
Point 12. Leblon Beach
Mar 2016
0
May 2016
8,570,000
various
no detection
various
no detection
simple grand mean
371,653
370,147,500
6,187
23,840
reference levels
US marine recreational water criteria for FIB (= danger level)
104
European marine recreational water criteria for FIB (= danger level)
400
Jiang et al . 2001 viral ranges detected in SoCal marine waters (Malibu to Mexico)
880
7,500
This is data is compiled from the summary report published July 2016 by the Associated Press. Monitoring locations were sprinkled across various Olympic venue sites in Guanabara Bay. Full data were not provided and so this emphasizes the max and minimum values based on geography. I have provided relevant reference levels to make interpretation of these values easier for the non-expert.
Waste litters the water as two sailors prepare for a training session at Rio de Janeiro’s Guanabara Bay. Image: AFP/Getty Images.
A body floats in the waters of Guanabara Bay, a sailing venue for the 2016 Olympics, in Rio de Janeiro, Brazil. Image: NY Times.
The edge of Rio de Janeiro’s Guanabara Bay. Image: AP.
The pollutants lurking in these waters are a who’s who of everything you might expect from a modern megacity and international port:
heavy metals: copper, lead, and the other usual suspects
persistent organic compounds: especially pesticides and environmental estrogens
excessive nutrients: especially nitrogen and phosphorus (in turn driving localized eutrophication and fish kills)
contaminants of emerging concern: generally industrial chemicals and pharmaceuticals with biological activity at exceedingly low concentrations (in the parts per million or parts per billion range)
marine debris & suspended materials: wood, tires, plastic, etc.
macro- and micro-plastics: while this is actually a subset of the broader debris, our work shows that we need consider plastics separately from other debris categories
petroleum: mostly coming from unrestricted, non-point discharges into waterways and shipping activity in the harbors and ports
corpses: dead vertebrates abound in Rio’s waters, including human bodies…enough said
While I can find no direct reported measurements of the following pollution categories, I strongly suspect these are impacting environmental quality in the region based on the gross conditions present in Rio and the background materials I have been reading:
thermal: water temperature abnormally elevated due to industrial activities, industrial cooling systems, proliferation of impervious surfaces, and urbanization
sedimentation
acoustic: excessive noise from coastal vessels and port activity
We already mentioned the lack of modern sewage treatment as a key stressor of water quality. We next need to add in good ol’ oil spills and related industrial releases.
Paulo Roberto Costa, a former Petrobras executive, being escorted by police after appearing before a Brazilian congressional committee investigating allegations of corruption. A Range Rover intended to be a gift to Mr. Costa led police to search his office and eventually to arrest him, and he later cut a deal with prosecutors. Credit Ueslei Marcelino/Reuters.
The wider world often associates Rio with scantily clad beach goers or folks dancing salsa during Carnival, but rarely associates this port city with oil and gas production. It is in fact better to conceive of this coastal port as the center of Brazil’s energy sector that it in fact is. Oil and gas accounted for 13% of the country’s GDP in 2014 (the most recent numbers I could find). Rio is the engineering and logistics center for the massive push to exploit reserves under deep water salt domes far offshore. The biggest player here is the state-owned oil company Petrobras, a major part of the unfolding “carwash” corruption scandal ripping apart Brazil this summer.
Unfortunately where we have production, we have spills. Rio is no exception to this. Add to this the typical lack of environmental oversight common in “emerging” or “developing” economies. Most of the oil and gas industry is operating here and across the country without strong environmental permitting. Environmental concerns take a clear back seat to business concerns. For instance, we see zero oversight for underground storage tanks, older refineries simply grandfathered into the production chain without serious attention to modernization to either reduce emissions or improve environmental safety, and weak institutional responses from governmental agencies when a mishap does indeed occur.
Comperj, a giant refinery and petrochemical complex built by the state oil company, Petrobras, in Itaboraí, Brazil. The unfinished project was originally planned to cost $6.1 billion, but a state audit put the price closer to $50 billion. Image: Andre Vieira for The New York Times.
Here is a brief rundown of a few recent notable oil spills in and around Rio.
Tarik Ibn Ziyad Spill (1975)
Significant spills along Rio’s coast date back to at least March 1975 when the Iraqi-flaged tanker Tarik Ibn Ziyad ripped open and as it was pulling into the Sao Sebastiao terminal at Santos, releasing an estimated 6,000,000 liters (1,585,000 gal., 37,700 bbl) of light crude oil over the next 15 hours into the bay and oiling the outer coastline. The spill was fairly dramatic with spilled oil catching fire both on the shores of the oiled Island of Fundao and the surface of the Jequia River (home to a biological reserve) wherein an unspecified amount of mangrove forest burned to the water line. As was so often the case back then, rudimentary monitoring techniques and response capability translated into relatively poor quantification of the impacts of this spill and few details can be found in either English or Portuguese sources.
By the 1990s Brazil’s nascent environmental oversight and assessment capabilities were another story.
Guanabara Bay Spill (1997)
An estimated 2,000,000 liters (528,000 gal., 12,600 bbl) of oil spilled from Petrobras’ pipeline running into their REDUC refinery in 1997, primarily flowing onto the coastline and into coastal waters. We saw significant oiling of littoral regions and the first big acute toxicity to wetlands and fish communities since the 1970s. This would set the stage for cascading implosions of Rio’s fishing industry over the ensuing years. This 1997 spill drove more than half the fisherfolk to seek alternative employment due to collapsed fish stocks and an associated inability to collect enough fish even for subsistence harvest. It also signaled the first widespread public outcry against oil spills and “business as usual” in the petroleum industry, but in practice almost nothing changed. It “primed the pump” for the public response to the spill three years later.
Guanabara Bay Spill (2000)
The most ecologically significant spill in the past few decades in the Rio region was arguably the January 2000 Guanabara Bay spill. In a redux of the 1997 spill, the Petrobras pipeline bringing crude into their REDUC refinery ruptured and released 1,300,000 litres (343,000 gal., 8,200 bbl). Oil was dispersed widely across the northern and northeastern regions of the bay fouling various islets, rocky beaches, sandy beaches and mangroves. Acute toxicity was clearly observed as we saw conspicuous die offs within the fringing mangrove community and many fish and invertebrate populations.
Workers clean an oil contaminated beach off Rio de Janeiro’s Guanabara Bay in 2000. Image: AP Photo/Renzo Gostoli.
Quite disturbingly, total Polycyclic Aromatic Hydrocarbons (PAHs) in seawater sampled at most monitoring stations ten days post-spill were within same range of PAHpreviously reported for Guanabara Bay (0.05 to 2.97 L-1). Fish tissue from two species in the immediate wake of the spill showed no significant elevation in PAH concentrations relative to reference samples from the same sites one year prior to the spill (15.8 to 76.3 µg kg-1) suggesting no elevated threat to the human health from this particular spill. One interpretation here was that there was nothing to worry about as we saw no elevated “oil signal” post-spill. Alternatively, you could read these results with grave concern, interpreting this as a bay so contaminated from day in, day out pollution that even such a massive spill doesn’t elevate exposure or risk. It was most likely the latter as SCAT surveys post-spill showed that at least 70 km of coastline was heavily oiled. In addition, coastal sediments showed clearly elevated PAH concentrations (see Gabardo, et al. 2003) relative to pre-spill concentrations.
In 2007, Petrobras was ordered to compensate fishermen $300 million for the loss of their ability to fish due to the outright destruction of the wide range of fish stocks. Sixteen years post-spill and nine years post court order, no fishermen have yet to see any money. I can find no evidence of significant ecological recovery of these impacted regions. Tech Insider reported the current situation of the fishing community last month:
Alex Sandro Santos, the president of the Fishermen Association of Tubiacanga, is a third generation fisherman in the area. Fifty years ago, he says, you could find dolphins swimming in Guanabara Bay. When a Petrobras petroleum plant opened up four decades ago, things started going downhill.
“With the growing population here, everything goes in the bay without treatment,” he told Tech Insider during a visit to Guanabara Bay in 2015.
At the beginning of that year, Santos recalls, a journalist from local publication O Globo threw a red ball into his bathroom toilet. He later found it in the bay.
Most fishermen have second jobs. They’re construction workers, cleaners, and boat renters for tourists on the side. Younger local residents see the dismal future in fishing on the bay and have started looking elsewhere. “There are lots going to deal drugs,” says Sergio.
Chevron Campos Basin Blowout (2011)
In something reminiscent of the 2010 Deepwater Horizon blowout, a Chevron-led drilling consortium working the Frade field 120 km northeast of Rio de Janeiro lost containment of their exploratory well in November 2011. That Campos Basin blowout the ran for four days and released 590,000 liters (156,000 gal., 3,700 bbl) of crude. Insufficient capping of the wellhead allowed the higher-than-expected wellhead pressures to kick out drill muds and defeat the cementing. Favorable winds and currents kept oil no closer than 100 km from shore and appear partly responsible for the amazingly low final settlement associated with clean-up/spill. Chevron shuttered their well for 18 months and ultimately settled with the Brazilian government for $135 million, a considerable “victory” f0r the company considering the government initially asked for $18 billion in damages. While Chevron was in no way responsible for the failed Olympic-driven efforts to clean up Rio’s waters, such a large settlement could most likely have assisted with several of measures identified in the Clean Urban Delta Initiative. Brazilian petroleum regulator ANP fined Chevron for failing to follow drilling plans, but absolved the company of negligence. Given the corruption and payola now swirling around Petrobras, the scuttlebutt at the moment is whether Petrobras’ 30% stake in the Frade consortium played a role in their winning such a light settlement.
The most recent release in the region was yet another pipeline spill, albeit a very small one. The June 2015 rupture of a Petrobras pipeline once again doused coastal wetlands in an estimated 600 liters (159 gal., 4 bbl) crude as it flowed down into the sea with an estimated 50 liters (13 gal.) making it to ocean waters. The “carwash” scandal was initially suspected of playing a roll with union officials and industry analysts concerned given the scandal appeared to be diverting the company’s attention away from routine operations and maintenance. But it quickly became clear thieves caused the spill as they attempted to steal oil.
As of 2016, the frequency of spills and ubiquity of petroleum contamination in both water and animal tissues are a source of increasing consternation for fisherfolk across Rio de Janeiro’s coast. Ongoing investigations into multiple deaths and disappearances of fishermen since the 2000 Guanabara Bay spill appear related to their calls to change the business as usual culture pervading the region. Investigations into that violence now appear to be at a stalemate. Fisherman Lauro Coelho Jr. told NPR last June “the oil industry is involved in an environmental and economic conflict in which there is a clash between development and the environment. And in the midst of this conflict, deaths occurred.” Coelho went on to say he had no evidence directly linking the fishermen murders and threats to any specific polluter. Petrobas has publicly stated their company is “unaware of these incidents and rejects any act of violence against the fishermen… All of our projects rigorously follow the various government environmental controls and are licensed.”
Degraded Ecosystem Function
The rapidly locally disappearing (and data deficient across its global range) Somalia fluviatilis. Image: Fernando Trujillo.
There are a variety of metrics showing reduced ecological structure and function across Rio’s coastal zone over the past several decades. But perhaps the clearest comes from the trajectory of the freshwater dolphin the tucuxi (Sotalia fluviatilis). Sergio Ricardo, director of the Bahia Viva NGO told Vice Sports a few months back:
“The great environmental indicator of the level of pollution in the bay is the tucuxi. In 1995 Rio de Janeiro State University identified 800 [tucuxi] in the bay, ten years later there were 400, and now there are just 35,” said Ricardo. “They’ve been described as the most contaminated mammals in the world.”
The fate of the tucuxi, a freshwater dolphin found in Brazil, also highlights the failure of the Rio state government’s Guanabara Bay Depollution Program, which began in 1995, has been extended several times, and has failed to produce significant improvements in the condition of the water.
According to Ricardo, Rio’s historic inability to clean up the bay meant the city’s pre-Olympic promises rang hollow. “We knew that the pledge to clean 80% of the waters of the bay wouldn’t work,” he said angrily. “The International Olympic Committee was highly irresponsible. If the depollution programs hadn’t worked in 20 years, how could they accept this target, which was obviously based on false promises?”
Dead fish float on the edge of Guanabara Bay in 2015, a part of which is the Rio 2016 Olympic Games sailing venue. The polluted bay receives a majority of the city’s raw sewage and officials have recently admitted their cleanup goals won’t be met in time for the Olympics. Photograph: Mario Tama/Getty Images.
51-year-old fisherman Robson Salgado de Oliveira told the same reporter:
“There was shrimp in the bay up until two or three years ago. And anchovies and hake, but now they’re basically extinct. I have to travel further and further away every day to get a decent haul. I work two shifts per day, starting at 3 a.m., and make around the minimum salary.”
An Opportunity Lost
Axel Grael, vice mayor of nearby Niterói and co-founder of an NGO promoting both sailing and environmentalism told the The Washington Post last year, “In the Glória Marina, the conditions are terrible… We had enough time…to make a leap in the environmental quality of the bay. There was a lack of political will and management initiative.”
Brazilian Olympic sailor Isabel Swan who won Bronze in 2012 defeatedly noted last year that she “always believed in the project Rio 2016 as something good for Rio. But the way things happen, the delay in things, the bureaucracy, these things mean that Brazil does not go forward. This is my sadness.”
And just in case you think all this attention will amount to continued global pressure or assistance from abroad post Opening Ceremony, you have to only go so far as to ask some of the athletes what they think. In an essay for The Guardian, U.S. Olympic rower Megan Kalmoe infamously addressed the polluted water concerns head on last week. She used not so subtle language and left no doubt that she was done with any discussion of environmental quality:
I have worked for 10 years to get to this point and will continue to work as hard as I can over the next few weeks to make the most of this very special and unique opportunity.
But all you want to do is talk about sh*t in the water.
My request to everyone who is fixated on sh*t in the water: stop. Stop trying to ruin the Olympics for us.
I can’t be sure when the first headlines about the water quality in Rio appeared and the conversation really started. But ever since then, it seems like it’s all people want to talk about. And I can’t really understand why. At this point, it is known that there are issues with the water quality. It is known that athletes are going to be at risk for illness. It is known that we are going to have to be smart, hygienic and take precautions. Great. Let’s move on.
What purpose does it serve to dwell on this? What benefit can we possibly gain from drilling athletes on their position on the water quality in Rio? None…
I will row through sh*t for you, America.
And I will do it gladly, and proudly, because rowing on this team in Rio is not something I’m afraid of, or going to complain about. I will do it, and I will defend fiercely the dignity of the people who are doing their best to make everyone happy while we are all guests in their beautiful country. I will do it, and I will try to discourage you from taking away even the tiniest bit of magic or excitement from a single one of my teammates who have earned this trip with their blood and sweat, and all of whom deserve to have a really positive experience in Rio.
So there you have it. It is apparently time to get on with the games. Because clearly, folks competing against one another is the only thing we should worry about these days. Somehow I think the NCAA and NFL would strongly agree with that sentiment.
It is almost one month since our most recent energy infrastructure foundering: Crimson Pipeline’s release of crude oil into the hills above the City of Ventura. Lots of developments continue to burble up as we all try to figure out the next what surprise.
As we assessed the spill in the immediate wake of that June 23rd release, I predicted this comparatively small volume of oil would be one of the easiest clean-up processes, happen very quickly (with primary recovery possibly needing only a few weeks), and felt that such a straight forward spill would translate into a superfast, straight-forward mitigation period. That just goes to show what I knew. While certainly not the end of the world, the last few weeks have been disappointing on many fronts. Some of these happenings are a consequence of particulars of the site and spill, but most seem to have stemmed from our expansive spill response bureaucracy and the lack of information/clarity from the responsible parties.
More Oil Than First Reported
The mantras I often push on my undergrads studying unfolding disasters are being borne out even in this small, contained spill:
“Never trust the first numbers.”
and
“Spillers minimize, enviros maximize, and our agencies are too understaffed and hampered by procedural weight to provide their own robust, independent numbers.”
The modern pattern we tend to see with everything from estimates of those killed in mass casualty events to the volume of pollution loosed into a waterway is inaccurate first appraisal. This phenomenon of inaccurate initial estimates appears to have intensified in our era of “numbers now.” Our instant social media and 24-hour news cycle increasingly prizes speed over accuracy and fosters an ever-larger and ever-louder megaphone amplifying whosever sub-optimal numbers are first into the slipstream. The anchor for a respected national news outlet interviewing a reporter at the scene of a breaking news event yesterday morning went so far as to say, “I understand that nothing is confirmed and the scene is chaotic, but can you give me any kind of number?” The beast must be fed apparently.
Add to this pressure for “numbers now” the inherent tendency of polluters (aka “responsible parties” in the parlance of our current environmental policy) to lowball the size of the release, environmentalists to overestimate the size, and regulators to simply parrot one or the other in the early hours and days. We are left with the situation where our final estimates of spilled oil nearly always differ substantially (often orders of magnitude) from the widely quoted initial estimates, regardless of the particulars of the spill in question.
Usually any such revision to volume released is made quietly and garners scant if any media attention. In the case of the Hall Canyon Spill (also referred to as the Groves Incident), estimates were revised upward and motivated coverage in the Ventura County Star a week ago. On July 8, Cal Spill Watch (the oil spill information page for the state of California’s Office of Office of Spill Prevention and Response) posted an upward revision to 171,000 l (45,000 gal, 1,075 bbls). This updated estimate came from Crimson Pipeline and was apparently revised thanks to the large volume of recovered oil tallied by the clean-up crews. This new estimate is 54% greater than that original estimate (although inline with my own higher end estimate from my visual inspection the morning of the spill), to date still widely reported as the older “almost 29,000 gallons” number.
Revised Hall Canyon Oil Spill Estimates
source
liters
gallons
barrels
My Iniital Estimate: High (June 23, 2016)
190,785
50,400
1,200
My Iniital Estimate: Low (June 23, 2016)
63,595
16,800
400
Official Estimate: June 23, 2016
111,291
29,400
700
Official Estimate: July 8, 2016
170,911
45,150
1,075
A Sense of Deception
Another depressingly common phenomenon in the wake of oil spills in our modern era is the nagging sense of not being told everything. Residents proximate to the spill feel this, the general public feels this, reporters feel this, scientists feel this, and often agencies or even the responsible party feel this. In short, the structures and procedures we have erected around such events are problematic. They have emerged from our overly litigious approach to dealing with impact assessment. The focus all too often is on assigning blame and seeking (or refuting) fiscal damages rather than on fully informing the general public or scientific community who clamor for answers.
Having been involved in such events for many years, I can tell you everyone I have encountered wants to clean-up and quickly mitigate any and all spill damages, but a huge amount of distrust and so-called recreancy exists between various camps and further adds to the bureaucratic layers. Case in point, the clean-up itself…
A Slooooow Clean-Up
Given that the oil spilled was limited to the very bottom of the Prince Barranca, it should have been easy to clean-up. Surface pooled oil was primarily suctioned up over the course of the first two days. As the creek bed was dry before the spill and the contamination was fairly constrained (generally 1-2 meters in width and perhaps 30 cm deep on average) over the course of the not quite three-quarters of a mile stretch of contaminated creek, it should have been easy to proceed to the next step of digging up and carting away all contaminated materials. This would have set-up the subsequent restoration efforts.
Panoramic of channel botton at the end of June 2016.
But one month out somewhere between 100 and 200 hazmat personnel from two different contractors are still engaged in a variety of pre-digging activities, only getting to the actual physical excavation over the past several days. Most surprising to me was the use of aggressive flushing of the creek with large volumes of potable water (up to 40,000 gallons a day) dumped into the gorge. The idea here was to try to remobilize oil retained in various pockets across the length of the barranca.
Spill recovery staging July 14, 2016.
Extensive infrastructure was installed by day two to facilitate clean-up crews accessing the site.
Sandbag dam for first water flushing trials in the Prince Barranca. July 29, 2016.
The decision to flush seems to have at least partly been motivated by concerns over trying to minimize the need to disturb soils that might harbor Native American artifacts. Additional concerns were voiced by agency personnel about the installation of steps down the ivy-covered hillsides of the barranca. We are therefore at best many weeks from cleaning up this site. All the while mobile wildlife are potentially exposed to remnant oil, likely attracted into this once dry, now wet barranca that serves as a wildlife corridor (agency officials are monitoring the area intensely now). We are also risking wider vegetation impacts as this oil sits and saturates into soils along the creek bank. Again, much of this is hard to estimate from outside the incident command given the lack of information coming out about the efforts within the barranca. And so this takes us to our next development…the PR story.
How to not get your story out
The first big PR “open mouth, insert foot” move of this spill occurred at the Ventura Town Hall just after the spill. A meeting was called on the low down by Crimson Pipeline. In truth this was not directed at nor advertised to the wider public. Rather it was an effort by Crimson to answer questions of residence in the immediate vicinity of the spill and make sure they had access to claims paperwork and points of contact of filing. What ended up taking place however was a PR nightmare for the company. It appears that they only sent representatives who knew about the claims process. Consequently when the audience (including Ventura County Supervisor Steve Bennet) asked questions pertaining to the material aspects of the spill such as expected duration of the clean-up, air quality measurements, pipeline repair progress, etc. the representatives appear to have not been fully briefed as one would have hoped. Amongst other things they failed to mention, the pipeline’s faulty junction/value that was at the epicenter of the spill was already repaired and mere hours away from being recharged with oil and returning to routine operation. I think it is fair to say that was not the best move when one is seeking to calm a nervous audience.
This and similar such opacity when it comes to finding concrete facts about the repair and clean-up have pushed Crimson into something of a defensive position to the point where they have begun turning to Op-Eds and Press releases to get their story out there. This culminated most recently in yesterday’s “dueling” op-eds in the Ventura County Star wherein Supervisor Bennett aired his concerns and Crimson Pipeline President Larry Alexander argued the case for the company in the midst of what he called “misperceptions” in the media and general public.
Amidst all this, I can see how some folks are left confused and wondering what is going on. Indeed, I feel like that most days! For now all we can do is stay tuned and hope for an increased rate of clean-up (and much less potable water being dumped down the drain).
https://cikeys.com/wp-content/uploads/2022/09/CI-Formal-Logo_2A-flat-300x50-1.jpg00Sean Andersonhttps://cikeys.com/wp-content/uploads/2022/09/CI-Formal-Logo_2A-flat-300x50-1.jpgSean Anderson2016-07-18 11:55:372016-07-18 11:55:37Ball of Confusion: Hall Canyon 1 Month On
Gabriel Anderson, 13, photographs a section of the oil spill in Ventura. He was with his father, Sean Anderson, a professor at Cal State Channel Islands, who was collecting samples to test for toxicity. Image: Mel Melcon, Los Angeles Times.
Yet another start of the summer and yet another pipeline break on the south coast.
A Year of Spilling Dangerously
Our oil infrastructure here in coastal southern California has certainly had a pretty horrid year. We started with last year’s mid-May Refugio Oil Spill. The largest oil spill in Santa Barbara County since the infamous 1969 Santa Barbara Oil Spill just kept on giving and giving in the form of sporadic tar balling of beaches across 170 km of coast into late June of 2015. As a consequence, my students, colleagues, and I spent the late spring and early summer of 2015 tracking tarring impacts across more than 50 of our southland beaches.
Unfortunately, we picked the wrong week to catch up on our sleep.
Hall Canyon Pipeline Spill
First map identifying spill site. Image: VCFD via @avmartinez
Kirk and Kelly Atwater and some of their neighbors woke to what they later recognized was likely a pressure release valve screaming an unusual whine around 4:30 am on Thursday, June 23, 2016. The Atwaters fell back to sleep, but were soon re-awoken by the pungent smell of oil wafting into their home. The increasingly strong smell eventually prodded them to walk out of their Ventura Hills home and search for the culprit. Kirk disappointedly found fresh crude flowing though a narrow creek that bisects his property above Ventura High School around 5:00 am. He hopped onto his Vespa and motored up to the oil pipeline a few hundred meters up the canyon from his home. Sure enough, the crude was pouring out of a junction box and flowing into the head of the Prince Barranca within Hall Canyon. Kirk first called 911 to alert the authorities and then called the “in case of emergency” 1-800 number affixed to the pipeline itself, reaching the pipeline’s operation control center in Long Beach, California. It was 5:30 am.
Rapid Response
The rest of us woke to news reports of a potentially very large pipeline break just east of the City of Ventura. Those first few dribbles of news suggested that as much as 200,000 barrels of oil might have been released into a creek and were apparently headed to the Ocean with a possible entry point near San Jon Road on San Buenaventura State Beach, one of our long-term sandy beach monitoring sites. It goes without saying that oil spills rarely fall on convenient days or happen at civilized times.
The previous evening saw our Sandy Beach Field Crew present the interim results of our 2016 Sandy Beach Rapid Assessment Synoptic Surveys of beach health and our assessments of Refugio Oil Spill impacts as of one year post-spill. We had just sent everyone off for some well-deserved vacation time when BANG! New Spill. Fearing several of our monitoring sites were about to (again) be hit by oil, I began reaching out to our just-deactivated field team. Several folks reported they could help, but would need a few hours to get back to town/finish-up long-postponed activities planned for that June 23rd morning. Not wanting to wait, I grabbed my son (a seasoned beach monitor, excellent parasite dissector, etc.) and we bee-lined to the City of Ventura. On our drive into Ventura, reports started trickling in that the oil appeared contained to the hillside region of Ventura near Grove Street and Grove Lane. We therefore elected to first check the origin site to confirm that oil was indeed contained near the release site.
We began by conducting a few driving transects from the 101 Freeway (near the beach) inland towards the hills on South Seaward Avenue and associated streets. Driving slowly with our windows down (and with frequent roadside pit stops), we could detect no petroleum odor as had been rumored to proximate to South Seaward Avenue. To be sure this was a qualitative assessment. But as we have seen in the past, were oil to get into storm drains or urban creeks you can rapidly see a progression of both petroleum and smells across the urban/coastal plain as those hydrocarbons migrate seaward through the urban matrix.
Following that brief odor inspection, we headed up into the hills above Ventura High School to get a firsthand read on the spill and figure out if we indeed needed to prioritize additional pre-oiling beach surveys.
A Fouled Barranca
Sean sampling the crude flow in Prince Barranca. June 23, 2016.
As we approached the Grove Lane area of the Ventura Hills, we quickly honed in on the cluster of fire, hazmat, and police just off Poli Street. As our goal was to not get in the way of any first responders, we went a bit farther up the hill from the primary aggregation to see if we might be able to get a sense of the magnitude of the release in this residential neighborhood. Within a minute or so we came upon a cluster of media disembarking from their TV vans, etc. along with a scattering of County Fire in the side yard of the Kelly and Kirk Atwater. We introduced ourselves and the Atwaters kindly invited us to come on in and take a look at the spill running through the steep ravine that bisects their property. After several minutes of answering the Atwaters’ questions, we headed down for an initial inspection.
With a friendly “be careful of the poison oak, its really thick down there,” we shimmied down the ivy-covered bank to where a few intrepid news photographers and videographers were collecting images of flowing oil in the small channel for their upcoming stories.
The pipeline release point was perhaps 500 m upstream from our inspection site on the Atwater Property. The Prince Barranca lies within the greater Hall Canyon and is a key tributary for local surface water migrating from the upper reaches of this section of the Ventura Hills down to the flatlands of the core of the City of Ventura and eventually into the arroyo that discharges into the ocean at San Buenaventura State Beach (one of our beach health monitoring sites) at San Jon Road. At the Atwater’s home, the rim of the gorge is spanned by a city water main essentially running straight across the perhaps 200 m span of the top of the channel, suspended perhaps 50 m above the floor of the barranca. The barranca’s sides run downward at slopes of 20 to 40° which made access a challenge for clean-up crews (later in the day they would cut steps into the slope’s face to make it easier to ascend and descend with equipment). Oil was flowing in the primary channel such that at peak the torrent averaged about 30 cm in depth (excluding pools) and one to two meters in width.
From afar I initially mistook this flow to be oil being discharged into a low flow channel capturing surface runoff. As I got closer it became clear that there was no water in this channel and I was seeing pure crude running through an otherwise dry channel.
About 400 m down stream from our inspection point, hazmat teams managed to bolster the berm surrounding a pre-existing debris basin at the end of the daylit segment of this channel before it runs under the core of city streets. Hazmat pumps and tankers were joined by at least two 3,000 gallon tanker trucks from the clean-up contractors by about 9:30 am. Major oil flows in the channel had effectively ceased sometime before 9:15 am.
By 10:00 am the oil level in the barranca at the Atwater property had dropped perhaps 10 cm (4 inches) and perhaps 20 cm (8 inches) by 10:30 am from the maximum oil level. From my quick inspection there seemed to be comparatively little soil penetration given the density of both river stone and the thick natural cementing of the sediments in the thalweg. The pumping out of oil from that debris basin seemed to be the primary driver of the quick draw down of the oil level.
Crew members work to keep crude oil from flowing into the ocean after a spill in Ventura, CA. Thursday, June 23, 2016. Image: Rob Varela / The Ventura County Star.
Spilled Crude
This oil was a light crude that exhibited surprisingly little volatilization. The heavy marine layer/June gloom clearly helped with that, but the lack of strong odors (confirmed by VOC sniffers in use by the firefighters distributed across the neighborhood) was still something of a mystery. We collected a few samples of the clean crude for subsequent toxicity experiments and (if needed) fingerprinting. This crude was extracted from backcountry wells elsewhere in Ventura County by Aera Energy.
Our most recent estimate of total oil released has not been updated since early afternoon on June 23. We know these numbers are often subject to revision (usually quietly, with little public attention), but for now our official estimate is pegged at 700 bbl (29,400 gal, 111,290 l). While this was an “up to 700 barrels” number in the words of the official press release from unified command, that seems within the ballpark of what I was seeing in the channel and debris basin. Look for a revised number when the clean-up crews wrap their operations.
Wildlife Impacts
Residents reported that this barranca is dry save for in the immediate wake of our very infrequent heavy rainfall. They couldn’t recall the last time the channel harbored significant flow, but it has clearly been at least several years. Desiccated and decayed algal thalli (presumably Cladophra spp.) in the channel substrate suggest that even the routine bankside irrigation by residents wasn’t enough to support significant algal or invertebrate communities. While I expect these organisms were more abundant in the deeper pools, those were totally obliterated by the crude oil and not assessable during my brief, post-oiling assessment.
A pair of Cooper’s Hawks (Accipiter cooperii) had recently taken up residence adjacent to this stream, hitting the local Mourning Dove (Zenaida macroura) populations hard. Other birds that were common include the usual suspects osuch as Buteo hawks and corvids. I saw no evidence of vertebrates coming into contact with the oil as of mid morning.
Archiving field samples in our lab. This crude was collected flowing in Prince Barranca. June 23, 2016.
The likeliest longer term impact of this spill will be to vertebrate movement. This barranca is clearly a wildlife corridor facilitating movement of small to medium terrestrial vertebrates (e.g. skunks, bobcats, coyotes) through this neighborhood. Oil and a lack of soft sediments made detecting any tracks or sign difficult, but the landscape strongly suggests such use (an observation later confirmed by local residents). It would be great to set-up a few camera traps in the ensuing weeks post clean-up to confirm such wildlife use as our lab has done elsewhere in the county.
Crimson Pipeline
Initial reports have now confirmed that a pipeline junction experienced some type of catastrophic failure rather than a corrosion-driven failure of the pipe walls per se as we saw with Plains All American’s Line 901 segment in Santa Barbara County that birthed the Refugio Spill in May of 2015. Oil was flowing from the 25 cm (10”) diameter V-10 pipeline that carries crude from inland production fields in Ventura County to Los Angeles refineries. V-10 is owned and operated by Colorado-based Crimson Pipeline LLC. As with so much of our oil and gas infrastructure, this pipeline is old. Company spokeswoman Kendall Klinger reported that while V-10 was built in 1941, it was well maintained, current with all relevant safety inspections, and has been actively maintained. Indeed, residents in the Hall Canyon area noted that workers we conducting repairs late into the night (to at least 10:30 pm, using high-output lighting arrays to illuminate their worksite) the evening before the spill. They were apparently working on that exact segment of pipe that failed and began disgorging oil hours later and subsequently referenced by Ms. Klinger.
Paralleling the Refugio catastrophe, suboptimal detection systems may have been a key point of failure. Pipeline spokeswoman Kendall Klingler subsequently reported V-10 had been emptied of oil earlier in the week for maintenance work, then subsequently re-charged with oil post-servicing (apparently the previous night). She suggested that the system was not fully pressurized at the time of the spill and that this lower than normal operating pressure of the line prevented the usual spill detection systems from working.
In the wake of this spill, several news outlets have noted that Crimson has a history of petroleum releases in recent years.
Crimson Pipeline Previous Spill History
Date
City
County
Cause
Initial Cost
oil spilled (l)
oil spilled (gal)
oil spilled (bbls)
net oil lost (l)
11/20/2006
Long Beach
Los Angeles
Corrosion
$100,060
318
84
2
159
4/24/2008
Ventura
Ventura
Failed Seal/Pump Packing
$654,300
1,061,876
280,518
6,679
0
12/9/2009
Ventura
Ventura
Equipment Failure
$10,347
0
0
0
0
7/1/2011
Huntington Beach
Orange
Corrosion
$911,000
3,179
840
20
795
8/17/2011
Fullerton
Orange
Excavation Damage (3rd Party)
$49,800
318
84
2
318
9/8/2013
Los Angeles
Los Angeles
Electrical Arc (from 3rd Party)
$3,107,125
1,590
420
10
795
10/6/2013
Ventura
Ventura
Equipment Failure
$190,000
79,494
21,000
500
1,590
11/12/2014
Long Beach
Los Angeles
Corrosion
$285,500
795
210
5
477
9/21/2015
Camarillo
Ventura
Corrosion
$41,675
3,816
1008
24
0
12/8/2015
Somis
Ventura
Excavation Damage (3rd Party)
$525,700
33,546
8,862
211
159
This summary is modified from the Pipeline and Hazardous Materials Safety Administration’s pipeline spill database. Data reflects the most recent update (May 1, 2016), I accessed the database on June 23, 2016.
Contractors working the scene and removing surface crude midmorning on June 23, 2016.
The federal Department of Transportation’s Pipeline & Hazardous Materials Safety Administration’s pipeline incident database shows Crimson’s California pipelines were responsible for 10 other spills (as of May 1, 2016) caused by corrosion, equipment failure, and other actors damaging their pipes since 2006. Half of these happened in Ventura County. The estimated 1,185,000 l (7,453 bbls, 313,000 gal) of petroleum released caused at least $5.8 million in property damage. It should be noted that nearly all the oil released from these spills was recovered during remediation efforts, that the median oil released per spill was 2,385 l with a mean release of 118,493 l per spill, and apparently one-third of these spills were caused by outside parties’ actions (when other entities were conducted excavation operations nearby a given oil pipeline segment, etc.). Lastly, it is important to keep in mind that the requirements for reporting any such spills have been tightened up in recent years and now include reporting what had historically been considered a negligible (non-reportable amounts) release.
Crews will need several more days of clean-up to harvest the last of the contaminated soils and associated materials. Restoration will, of course, be a longer-term game.
Helping the Public Understand
Here are a few of the stories that featured our lab or used our lab on background in the wake of this spill:
Today I received a great letter in the mail from Southern California Academy of Sciences letting me know that my presentation at the annual meeting one the “best student presentation” award. I am honored and excited to continue to share my research and continue on to grad school in the future.
https://cikeys.com/wp-content/uploads/2022/09/CI-Formal-Logo_2A-flat-300x50-1.jpg00Dorothy Hornhttps://cikeys.com/wp-content/uploads/2022/09/CI-Formal-Logo_2A-flat-300x50-1.jpgDorothy Horn2016-06-03 23:46:362016-06-03 23:46:36Best Student Paper Award from SCAS!
The one-year anniversary of the Refugio Oil Spill has brought with it a raft of renewed interest in this oil spill and the consequences as we now see them. We’ve done a good deal of media over the last couple of weeks. Add to that plenty of breaking stories from all quarters (often speaking to pending or future litigation) and the public now has a much better sense of what actually happened in the lead-up to the spill as well as the still-growing legacy of this injury.
What follows is my take on what we know as of May 19, 2016, 365 days post release of oil. This is the first in a series of posts about what happened and what we know of the impacts from the largest oil spill on this stretch of our California coast since the infamous 1969 Santa Barbara Oil Spill.
Factoids:
An estimated 148,000 gallons of oil released, with at least 60,000 gallons accumulating on the beach/nearshore ocean at Refugio State Beach.
Pipeline operators were unaware oil was spilling from their rupture pipeline. Failing to detect the leak, the controller even restarted the line after the spill occurred.
Actual response/clean-up did not begin until Day 2.
Timeline:
Relevant Pre-Spill History
note: This is a very short list, but it represents what I have found to be often under-appreciated facts, essentially to understand the Refugio Spill.
Summerland oil piers near Santa Barbara, circa 1901-1903. Image: Title Insurance and Trust/C.C. Pierce Photography Collection, USC Libraries.
1890’s: oil discovered in Summerland California and western Ventura County.
1969: January 28, Union Oil Platform Alpha off of Summerland, CA suffers a blowout beginning the Santa Barbara Oil Spill. At the time it is the largest marine oil spill in U.S. History. The spill is mythic and became a central part of the origin story of the modern environmental movement. To say the the ramifications from this event were huge is an understatement. This spill helps usher in the modern era (the so-called “Golden Age”) of Environmental Legislation, helping build tremendous support for new state and federal laws such as the Endangered Species Act, Clean Water Act, National Environmental Policy Act, California Environmental Quality Act, and California Coastal Act.
1989: Exxon Valdez Spill covers Prince William Sound with north slope Alaskan crude after the drunken captain leaves navigation to a junior officer as he sits in his cabin below decks. This spill motivated the phase out of single hulled oil tankers, fostered the Oil Pollution Act of 1990, and spurred the best suite of oil spill impact studies to date. This also leads to the creation of our current suite of Natural Resources Damage Assessment protocols, activated post spill to documenting spill impacts.
2010: Deepwater Horizon’s failed cementing of an exploratory wellhead into the Macondo lease off the Louisiana coast leads to 87 days of continuous oil flowing into the northern Gulf of Mexico and creating the largest marine oil spill in U.S. history and the deepest such blowout ever. Most of this impact was at the bottom of the ocean and the midwater region of the water column, although significant surface and littoral oiling occurs. While a temporary deepwater drilling moratorium was enacted, it was soon repealed under political pressure from the oil and gas industry. No significant legislation nor any substantial policy resulted (save for breaking up of the Minerals Management Service into daughter agencies) from this unprecedented spill, the first time a spill of such magnitude lead to effectively no change in oil spill response.
2012: Plains All American detects significant corrosion issues with Line 901.
Refugio Spill Day 1: May 19, 2015
note: My own recollections and notes are augmented below by testimony by Plains All American Pipeline, Pipeline and Hazardous Materials Safety Administration, Santa Barbara County Fire Department, Coast Guard, and the U.S. and California EPAs.
The oil pipeline rupture at Refugio State Beach may have spilled as much as 105,000 gallons of crude, authorities said. (Al Seib / Los Angeles Times)
prior 10:45: Plains All American pipeline segment 901 ruptures due to extensive external corrosion of the metal pipe and begins leaking oil for some unknown period of time through paper-thin pipe walls. The rupture happens landward of the 101 Freeway, just inland from Refugio State Beach about 32 km (20 mi) west of downtown Santa Barbara.
10:45: The 61 cm (24”) pipeline segment 901 that transports crude oil roughly 18 km (11 mi) between Las Flores Canyon and Gaviota has ruptured. Plains All American’s Midland, TX pipeline command center shuts down oil flow in the pipeline by depowering pumps at the their inland Sisquoc Station for inspection and maintenance. The company is oblivious to any oil spillage and does not realize oil is flowing unchecked into the environment at this point.
10:55: Pipeline pumps are restarted, pouring pressurized oil out of the pipeline fracture. Pumps are shut down again approximately 20 minutes later. Within three minutes of restarting, pressure plunged to 199 psi, triggering a low-pressure alarm that quickly resets when pressure climbed just above 200 psi. The alarm was set to be tripped at such a low pressure that it never sounded again as oil flowed out the pipe at just above 200 psi trigger level. An additional leak detection system that also would have sounded alarms had been disabled by an operator who was dealing with another problem/maintenance.
11:15: Pipeline pumps are turned off again, still with no realization by operators any oil has spilled.
11:30: A Plains operator remotely shuts down the entire pipeline because of pressure anomalies causing concern in the pipeline command center in Midland, TX.
11:42: An unidentified member of the public at Refugio State Beach calls 911 reporting a pungent smell. Santa Barbara County Fire Department and California State Parks respond to the 911 call as (crazy as it may sound) a preparedness drill with emergency workers and Plains employees is about to start. These first responders (not the company) reach out to the National Spill Response Center (an informational clearinghouse for releases of hazardous substances) to report a potential oil spill based on the heavy crude oil smell in the air.
12:20: Firefighters finally discover oil flowing across the beach and into the ocean.
This classic image of Derek Fisher holding onto the shirt of Steven Botello on May 19, 2015 as he reaches out to an oil soaked bird on Refugio State Beach. Image: Lara Cooper/Noozhawk.
12:30 Plains dispatch in Midland, TX dispatches a worker to do a visual inspection of the pipeline, still unaware an oil spill is in progress.
12:39 The Coast Guard is notified.
12:47 The Coast Guard calls the National Spill Response Center to confirm and oil spill has happened.
13:30: A Plains All American employee finally confirms an oil spill has happened. About the same time, Santa Barbara firefighters manage to partially staunch the flow of oil onto the beach by damming a storm drain with dirt and rocks.
13:56: The National Spill Response Center notifies the Federal Environmental Protection Agency a spill has occurred.
14:56: Plains All American notifies National Spill Response Center a spill has occurred, estimating at least 21,000 gallons has leaked (current estimates put the volume about seven times this amount).
15:00: California State University Channel Islands is notified of an oil spill. Our ESRM Program immediately begins mobilizing field crews to sample sandy beaches, an annual task routinely scheduled to begin June 1 of each year. This was no small feat as the semester had concluded the week before.
Kelsey Gerckens of KEYT3 News interviewing Dr. Anderson on May 19, 2015.
16:00: Refugio State Beach is closed. It will remain closed until July 17.
sometime before sunset: Clean Seas oil spill response vessel arrives on scene, but determines it can do little before sunset and will not be able to mobilize its required fleet of voluntary fishing vessels to help with surface booming to contain floating oil until the morning.
16:30: traffic slowdowns have become extensive along the 101 Freeway adjacent to Refugio Beach as onlookers attempt to view what is happening and California Highway Patrol attempts to block drivers from pulling over along the roadside for better looks. At least two private citizens operate drones near the site (an action still totally legal and permitted at this point). My neighbors who happened to be driving by Refugio at the time and were unaware of the spill reported a very pungent smell that was not alleviated with closed windows nor recirculated air. They also reported headaches.
evening of May 19: media reports a spill has happened and that Refugio State Beach is closed, but with almost no facts they report mostly speculation and eyewitness accounts from beachgoers.
Refugio Spill Day 2: May 20, 2015
ESRM Sandy Beach Team members Chase Tillman and Paul Spaur exchange observations with a bird monitor at El Capitan State Beach on the morning of May 20, 2015.
5:00: the Incident Command formally activates, airspace over the spill is closed, ocean vessel traffic is restricted
6:30: CSUCI’s ESRM Rapid Beach Assessment Team is onsite at El Capitan State Beach, conducting rapid beach health assessments. No oil has yet arrived to El Capitan sands, Clean Seas in booming the ocean surface just offshore of El Capitan Beach.
9:30: State Park Lifeguards begin asking campers at El Capitan to voluntarily remain on the bluffs and not come down to beach.
11:00: State Park Lifeguards begin to close El Capitan State Beach, informing campers that they must evacuate state property immediately. We conclude our sampling of El Capitan State Beach just as Lifeguards formally close the beach to public access.
12:00: Our ESRM team is refused access to Refugio State Beach and out petition to map spill extent with our drones go unanswered, even after being asked to help map the site by one federal agency (but that is a story for another time).
13:00: ESRM samples Gaviota State Beach. We begin to be inundated with media requests for reports of impacts and first hand observer accounts of the spill.
prior to 17:00: the first oil begins arriving on El Capitan State Beach.
NBC4’s Gordon Tokumatsu interviewing Dr. Sean Anderson at El Capitan State Beach on May 20, 2015.
Stay tuned for the next post with the continuation of the Refugio Timeline…
The one year anniversary of the Refugio Oil Spill is fast approaching. Lots of folks have been asking my colleagues and me about the impacts of this spill now that we have the perspective of a year. Well, first and foremost, I’m hugely appreciative to the repair man.
The repair guy (I assume it was a dude) with whom I would love to raise a few beers in gratitude is the as yet unidentified pipeline worker who decided to get to his presumably routine maintenance of the Plans All AmericanPipeline Line 901 just after midday on May 19 of last year. Before he could do this, he called into the Plain’s pipeline dispatch and asked them to temporarily (or so he thought) shut down flow in this conduit shunting oil from our offshore fields in the Santa Barbara Channel into inland refineries in Kern County. No sophisticated sensor or switch or command systems stemmed the oil; it was likely a guy in khaki Carhartt’s looking forward to the weekend. You know: the dude to whom I owe that beer.
That lucky break kept the oil released onto our coastal bluffs and ocean to an estimated 148,000 gallons of crude, a comparatively moderate amount all things considered. (Note that the actual estimate of release has fluctuated over time, as such numbers are wont to do in these situations. See the Wikipedia history on the Refugio Spill entry). Given that this pipeline can transport upwards of 2,000,000 gallons a day, we got off lucky with our taint something less than two hours of pipeline flow. Considering the slowness of the initial response, the amount of crude spilled could very easily have been at least double or triple that.
An estimated 80,000 gallons of the petroleum released pooled landward of PCH in a swale near the rupture, with at least 60,000 gallons accumulating on Refugio Beach or in adjacent nearshore waters. We now know that this ocean spill was triple the initial official estimate of 20,000 gallons of oil reaching the sand, an amount my fellow field scientists and I found immediately hard to believe based upon what we were seeing.
While this was a significant spill to be sure, it was still small in the grand scheme to things (about 15 semi-tankers worth of goo or less than 0.01% of the 1969 Santa Barbara spill). That plus the fact our local ocean has just entered some new era of transition (with emaciated pinnipeds lolling up onto our beaches, depauperate invertebrate communities along our shores, etc.) has made detecting a clear ecological signal of this spill hard to suss out from the noise of this era of increasing coastal degradation. Nevertheless, we have documented clear harm from this oil upon the sand-swelling critters of the south coast.
We’ve seen the clearest impacts of this spill in our human systems. My colleagues and I have documented clear, acute economic harm from this spill across Santa Barbara, Ventura, and Los Angeles Counties with beach goers spending less money at beaches more heavily hit by tar balls than at beaches untarred or only lightly tarred. We’ve also seen longer term economic ripples as drillers like Venoco declare bankruptcy due to the indefinitely shuttered pipeline. Some estimates place the ultimate liability to Plains All American upwards to a quarter of a billion dollars.
image source: unknown
Through this whole mess the spill’s Joint Incident Command (while ultimately capable on the actual cleanup side of things) left much to be desired. It proved a dismal communicator of information to the public, a bureaucratic morass often deaf to the concerns of sister agencies and the public alike, and not nimble enough to take advantage of the most sophisticated tools we had at our disposal for monitoring and characterizing the rapidly-unfolding spill. Our opinion polling shows this acted to further eroded public confidence in our government’s ability to respond to such disasters in a timely and open manner. Deepwater Horizon anyone?
But through it all, I’m still thankful to our unsuspecting repair man for making that call to turn the pipe to “off.” Now if I can just get his phone number, I have a few beers here…
Update: And here comes the big one
Two days shy of the first year anniversary of the spill, a Grand Jury has indicted Plains All American. The details are still coming out, but the LA Times noted just after 9am (and ultimately in an improved, revised version here):
A pipeline company said Tuesday it has been indicted in connection with a massive oil spill last year in Santa Barbara County.
Plains All American Pipeline said the company and one of its employees was indicted by a state grand jury on 46 counts related to the May 2015 spill. Both state and local prosecutors had been investigating possible wrongdoing related to the pipe rupture, which sent oil onto beaches and into the ocean.
The corroded pipeline owned by Plains All American Pipeline ruptured May 19, 2015, and spilled roughly 101,000 gallons of crude along the coast near picturesque Refugio State Beach west of Santa Barbara. About 21,000 gallons made its way from where the underground pipe is buried above U.S. 101 into a storm culvert and flowed into the Pacific Ocean.
Some tar balls from the spill were found as far away as Manhattan Beach in Los Angeles County, state officials said this week.
The section of pipe that broke had worn down to 1/16 of an inch, and investigators found a six-inch crack along the bottom of the pipe, according to preliminary findings from the federal Pipeline and Hazardous Materials Safety Administration.
In a statement, the company said: “Plains believes that neither the company nor any of its employees engaged in any criminal behavior at any time in connection with this accident, and that criminal charges are unwarranted. We will vigorously defend ourselves against these charges and are confident we will demonstrate that the charges have no merit and represent an inappropriate attempt to criminalize an unfortunate accident.”
Prosecutors could not immediately be reached for comment.
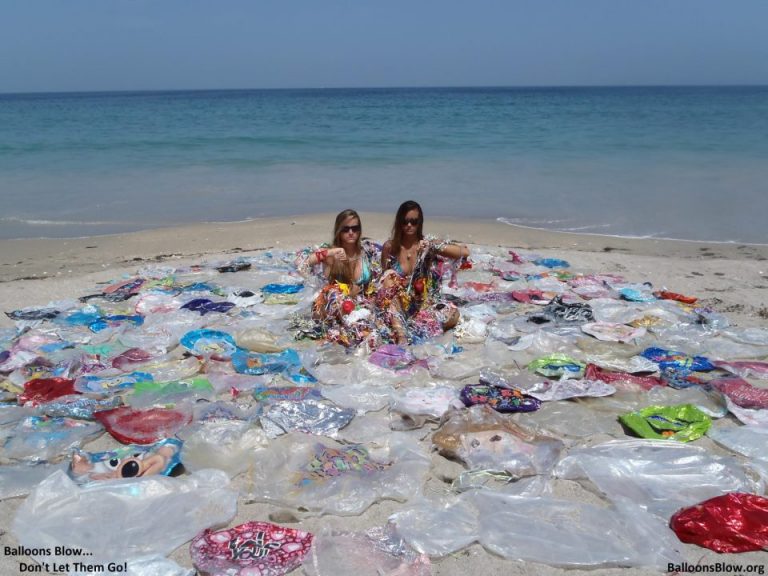


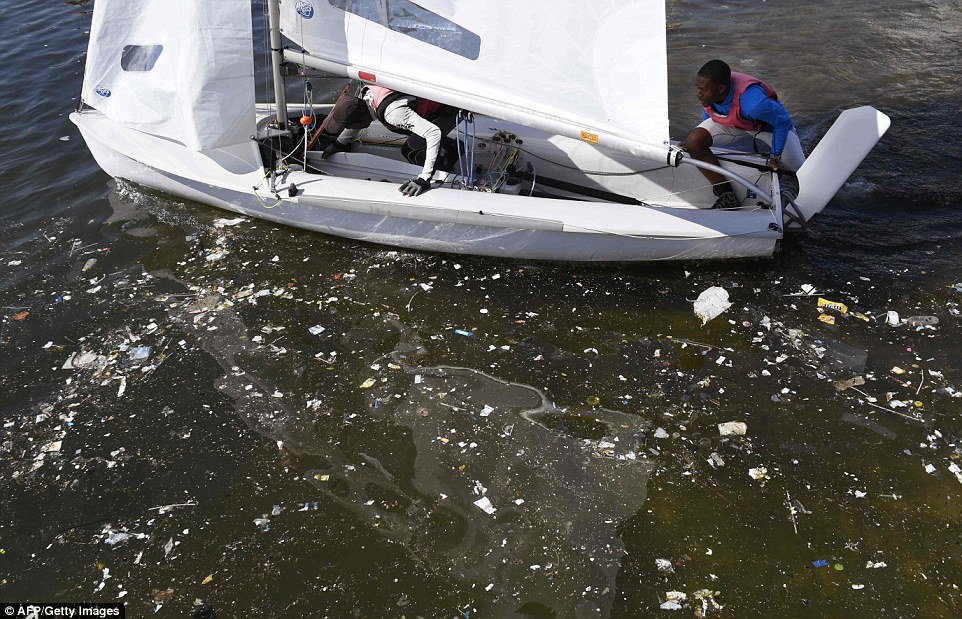
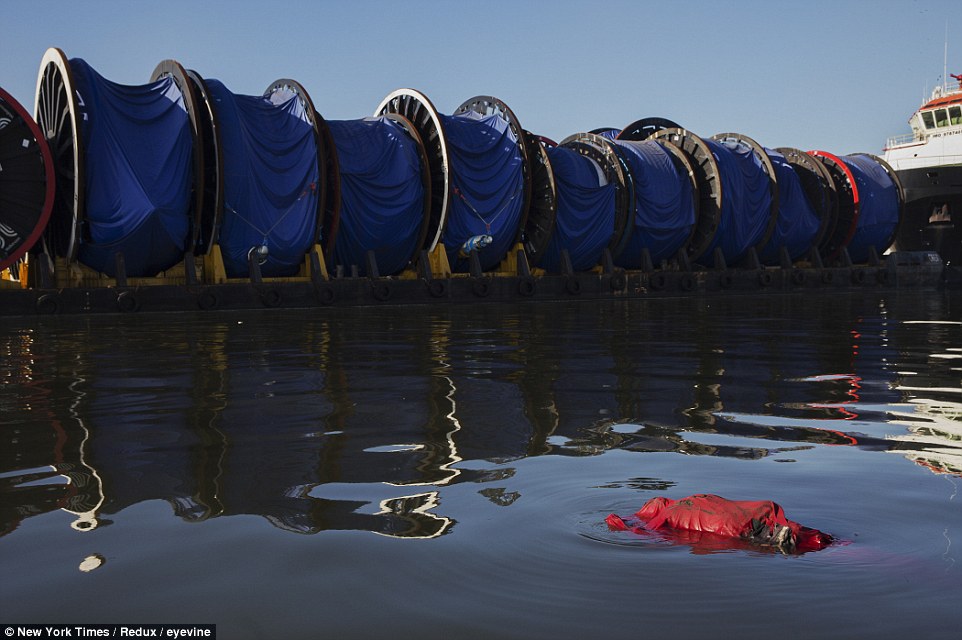


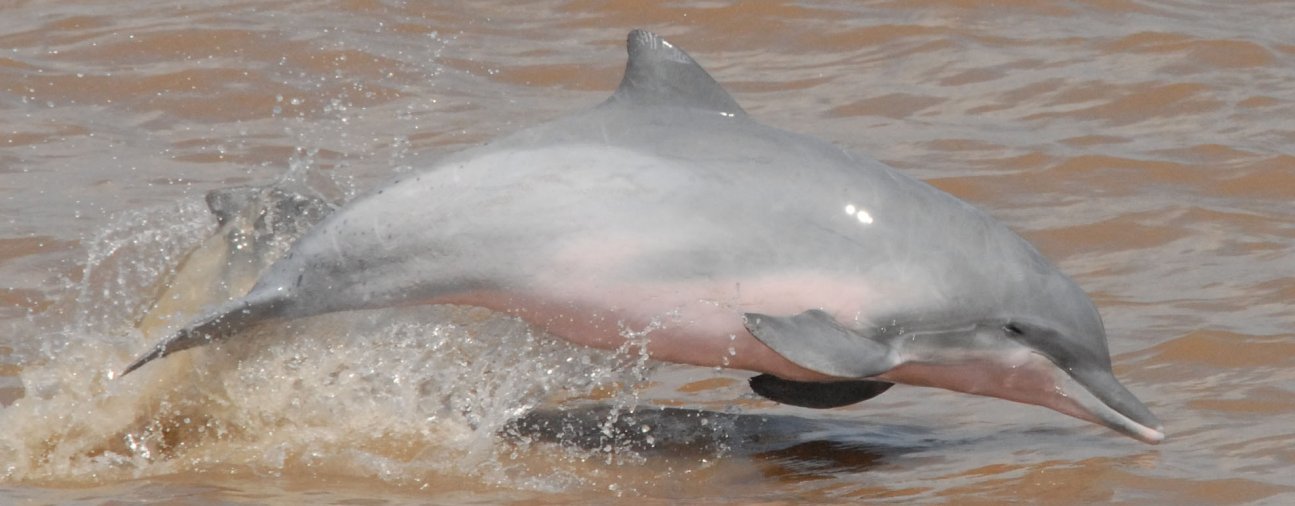
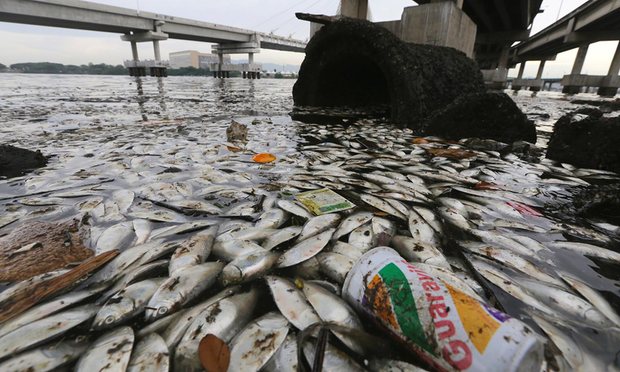


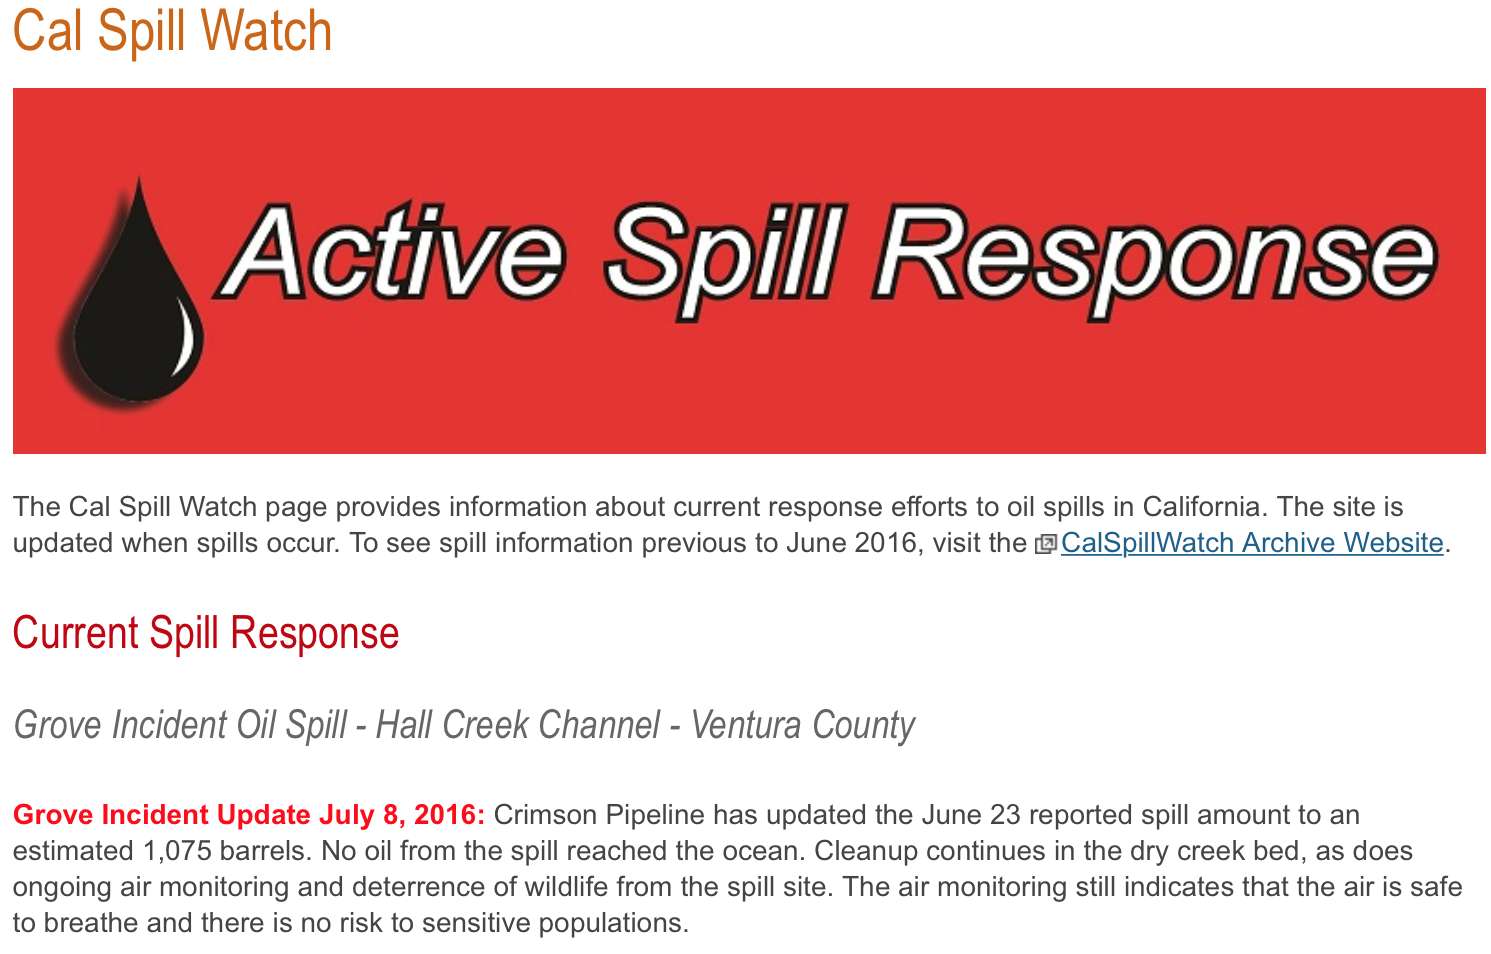


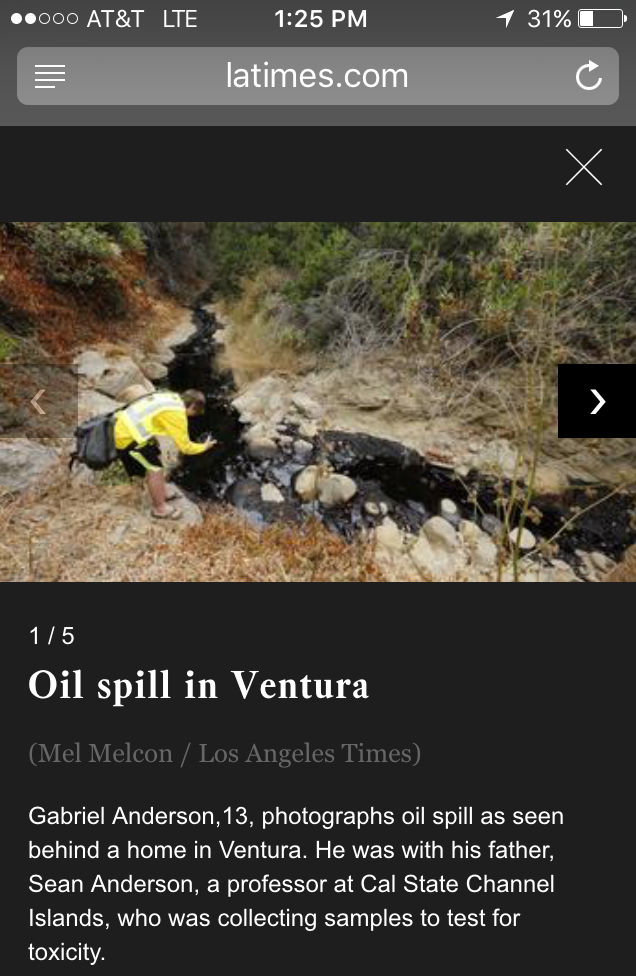


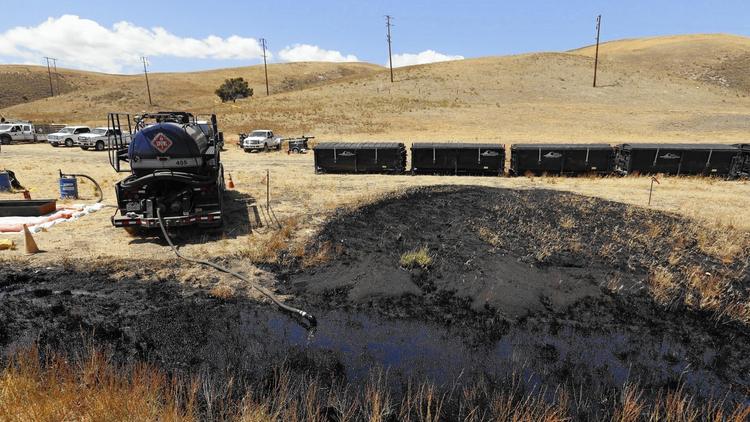


