This past week, I was working on my results where I found that there is a decline in the Torrey pine population growth within the demography plots. It is quiet fascinating, in how Travis Hall and Andrew Brinkman found that the population was increasing with their data collection. Additionally, it will be interesting to see how this data will will correlate with the common garden experiment, which might shed some light on why there has been a decrease in the population growth.
TPSNR Torrey Pine Tree – These trees are to be much larger than the SRI Torrey pines.Premature TPSNR Torrey Pine Cones
https://cikeys.com/wp-content/uploads/2026/09/ci-logo-ciKeys.png00Evangeline Forsterhttps://cikeys.com/wp-content/uploads/2026/09/ci-logo-ciKeys.pngEvangeline Forster2016-02-28 23:16:042016-02-28 23:16:04Results and Common Garden Update
This week was spent working on the results section of my paper. Last week I found that the data has shown a slight decrease in the SRI population. While this has likely been happening for some time it is interesting to see the change in the short period the population is being monitored. This past week I interpreted some of the point data from the GPS used in the field. I also explored the change in area seen on arc map between the four groves over the last 76 years.
This weekend I have been finishing up maps and extracting vegetation data by three slope categories (0-10%, 10-30%, 30-90%). The vegetation data was extracted from a 1993 map and the 2015 map to figure out the change for each cover type. The largest decrease in cover was found in annual and foothill grassland while the largest increase was in woody scrub (Lupine/Baccharis).
The most dramatic changes at Port Hueneme can be seen at Transect 1. The top photo taken in October had a beach length of 90 meters to the edge of the scarp. Currently (2/27/16), the beach is 5 meters to the edge of the scarp. As the sand is migrating south, more and more riprap is becoming exposed. I predict that within the next few months, Transect 1 will be completely underwater and unable to survey with the automatic level.
Had a great time on Saturday working with Ventura Surfrider and Ventura Audubon to clean up the nesting area for the threatened Snowy Plover at Ormond beach. This is my second season working with the local nest monitor for the Western Snowy Plover and California Least Tern. I brought my niece and nephews out to learn about the habitat and why picking up trash is so important.
https://cikeys.com/wp-content/uploads/2026/09/ci-logo-ciKeys.png00Sean Andersonhttps://cikeys.com/wp-content/uploads/2026/09/ci-logo-ciKeys.pngSean Anderson2016-02-28 18:31:552016-02-28 18:31:55Ormond Beach Clean up for the Threatened Snowy Plover
This weekend I worked with kids from Robert J. Frank Middle School in the NOAA B-WET Program at the CI Boating Center. The kids worked on their scientific presentations and got a chance to kayak around the beautiful Channel Islands Harbor. Its great to see future scientists in the making!
https://cikeys.com/wp-content/uploads/2026/09/ci-logo-ciKeys.png00Sean Andersonhttps://cikeys.com/wp-content/uploads/2026/09/ci-logo-ciKeys.pngSean Anderson2016-02-28 18:27:122016-02-28 18:27:12Weekend with Science Kids
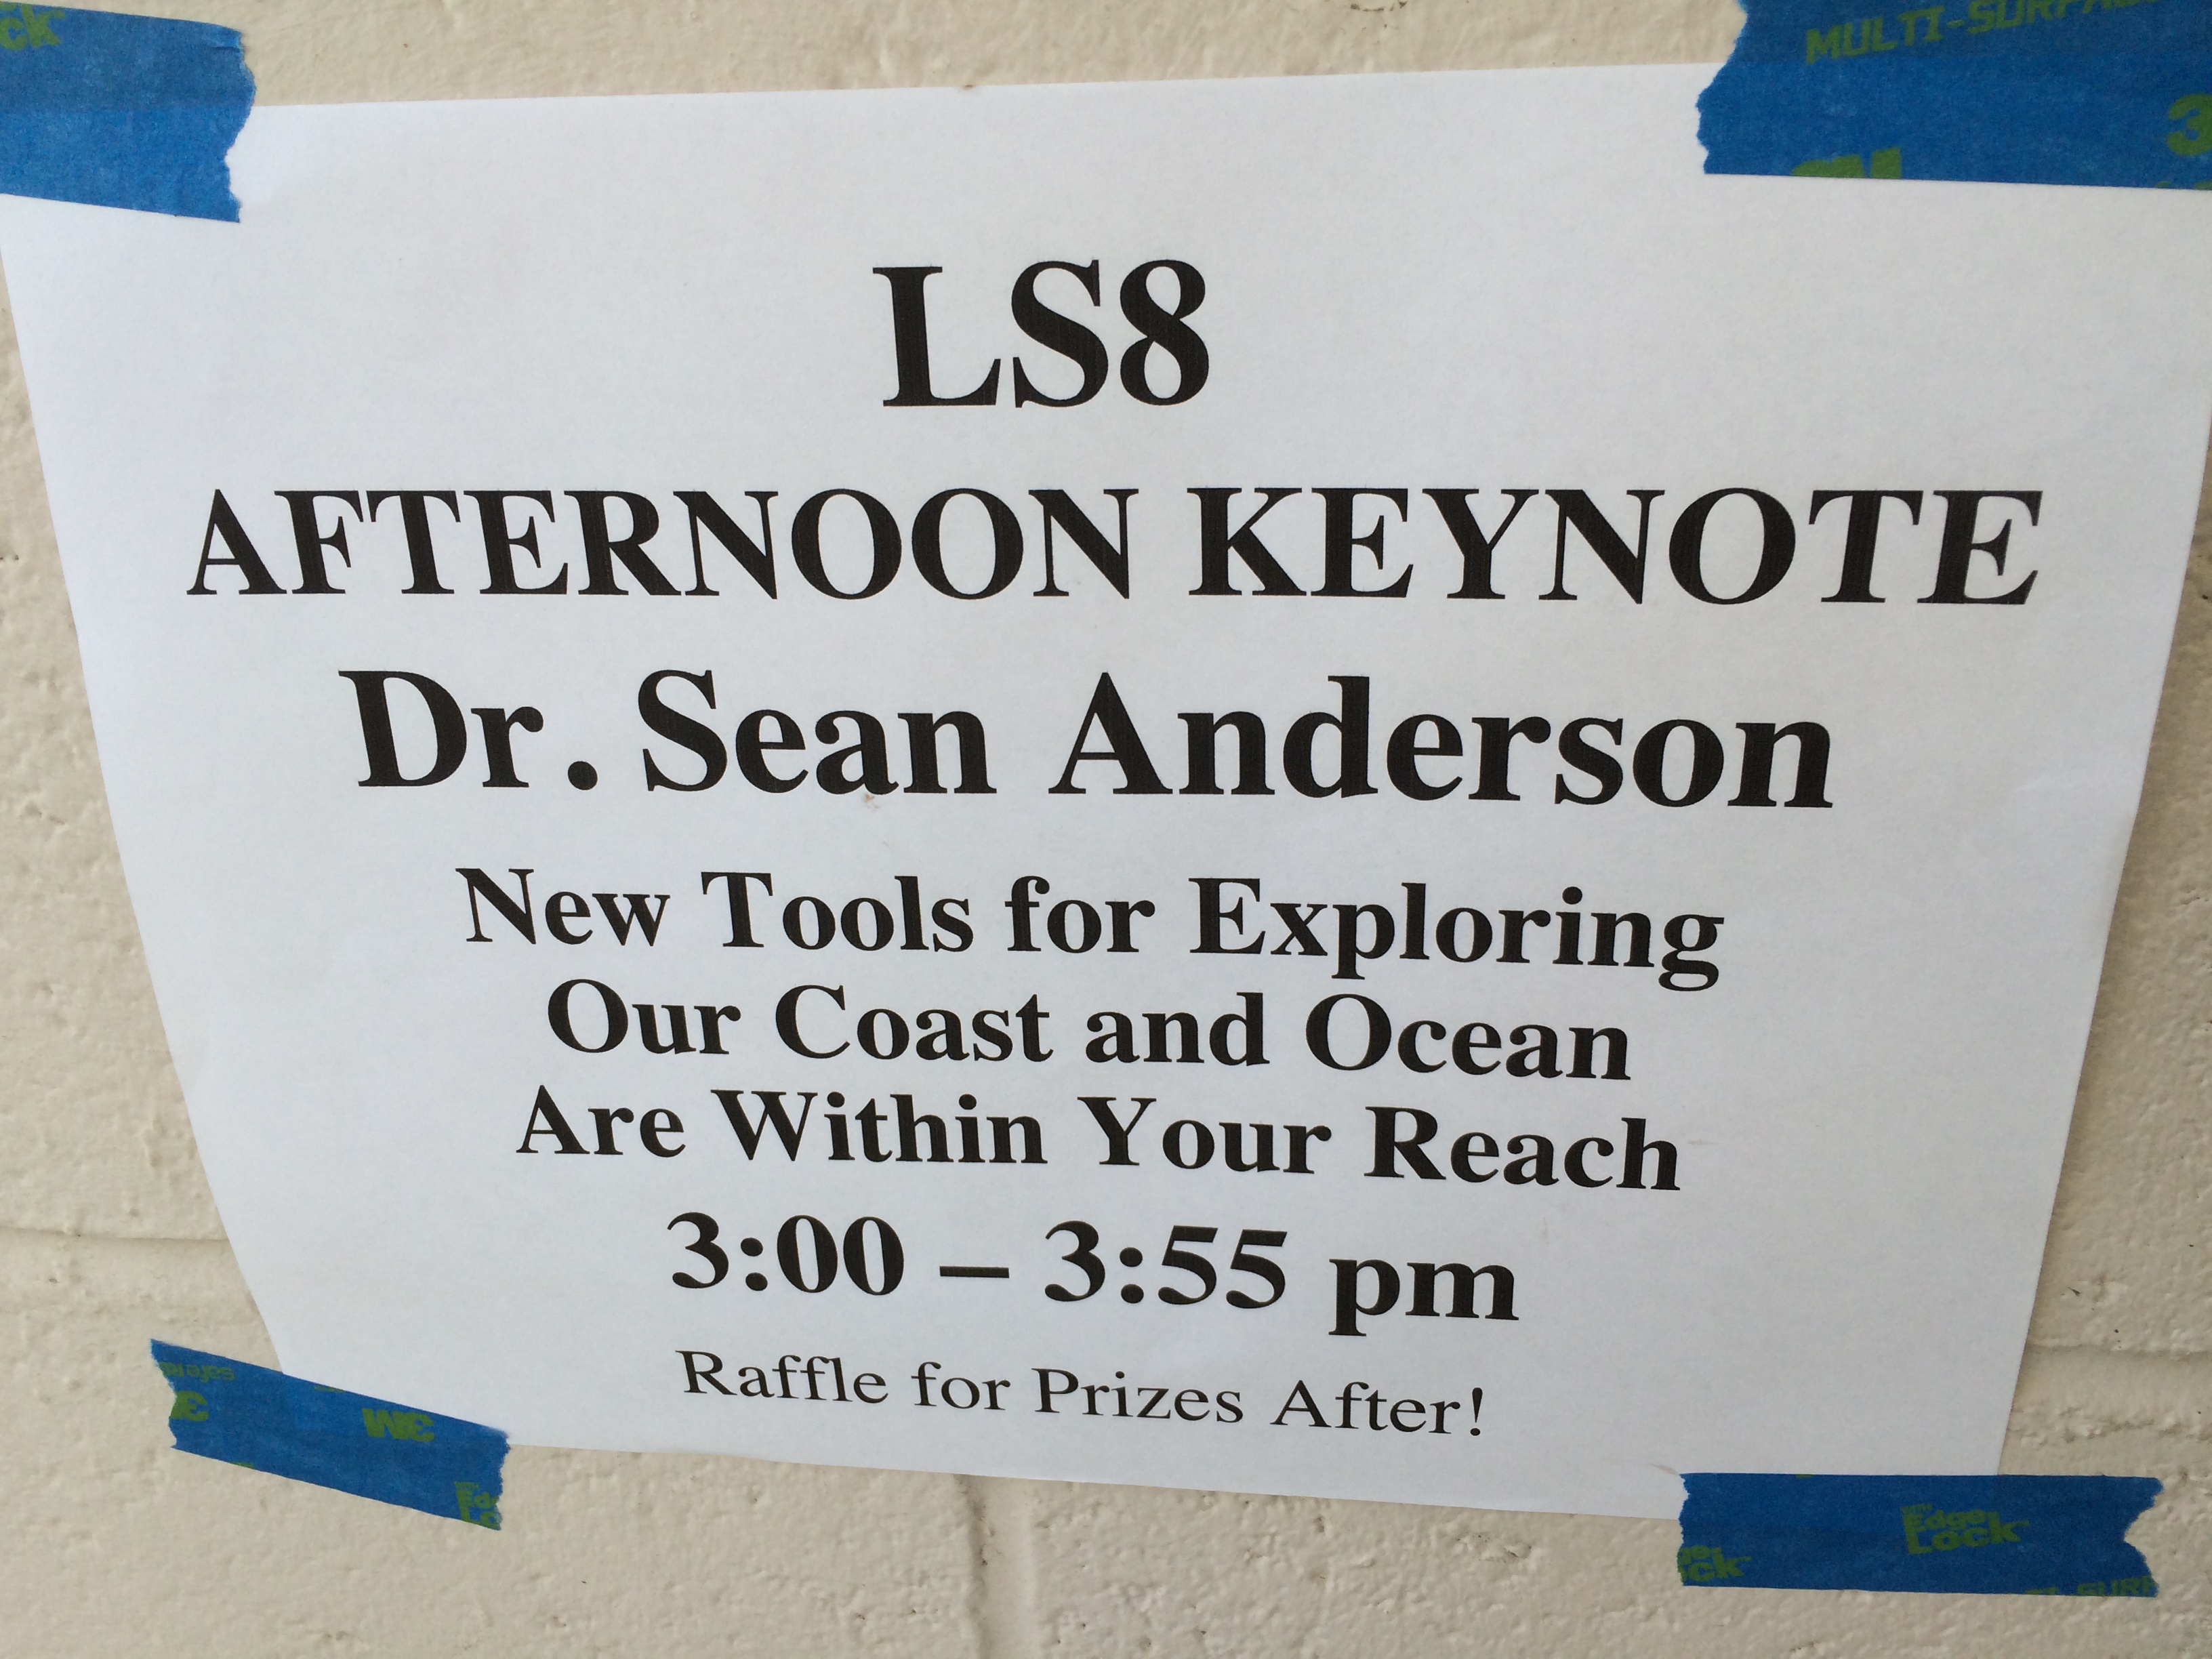
Our AARR Team was graciously invited to be a part of this year’s annual conference for the Gold Coast Science Network. This professional society for K-12 educators across our region of southern California draws their members from a area roughly bounded by San Luis Obispo County in the north, Orange County in the south, and inland as far as Kern County and the Inland Empire. In existence since the mid 1990’s, this year marked their 11th annual conference showcasing talks about the most recent approaches to imparting scientific discovery melded with dozens and dozens of practical teaching demos/hands-on lab development charrettes.
CSUCI’s Dr. Jerry Clifford runs a session on how he has successfully engaged middle school students in summer programs at El Rio by emphasizing exploration, estimation, and curiosity.
Showcasing AARR Robots
Forrest, Tim & Chase at our AARR Table.
Students from our AARR lab group were a hit at our demonstration table where we showed off a few of our aerial and aquatic robots we use for research and teaching. Forrest, Tim, and Chase did a fantastic job of showcasing our work and units while fielding any number of questions about the technology and how we use it to engage learners.
Plenary on Conservation Mechatronics
After a day of demoing and discussing all manner of robots and methods to captivate students with science, Dr. Anderson gave the closing plenary to a super packed auditorium with his typical, highly energetic zeal. It was the end of the day and a bit warm in the room, but those teachers were truly anxious to hear about all the great stuff we have managed to cook up at CSU Channel Islands over the last few years.
Screencast of Dr. Anderson’s plenary:
Dr. Anderson’s slides are free to download (via Research Gate) here.
Dr. Anderson’s Plenary Abstract:
A literal and figurative sea change is all about us. As our water world is facing unprecedented assaults from our burgeoning human population, a new panoply of tools is falling into our hands to help us better understand those changes. These tools offer us an unprecedented opportunity to explore our oceans with a precision and scope heretofore restricted to only the most cutting edge research institutions. Our Aerial and Aquatic Robotic Research (“AARR”) Group at CSU Channel Islands has brought key capabilities to our on-going interdisciplinary coastal investigations. Only in the last few years have we been able to take advantage of affordable, miniaturized electronics ushered in by the smart phone revolution. Cheap, power sipping computer chips are melding with ever smaller, lighter batteries, 3D printing, and the open source movement to put the ability to explore our marine environment into nearly everyone’s hands. Where half a million dollars used to buy you a so-so underwater Remotely Operated Vehicle, we can now build something quite similar or even more capable for $800. CSU Channel Islands is fast becoming the go to location for such innovation. We are training everyone from our undergrads to local middle schoolers to design, build, service, operate, and collect robust data with these tools. We will discuss our efforts, ideas for how you might get going, some of the new insights we are gaining by having these new capabilities, and demo some of our platforms.
More Videos
Links to our videos Dr. Anderson mentioned in his talks that may be of interest to you or your students:
An example 3D map
We created this from a single, 15 minute drone flight using photo stitching software. Note: this will run in any browser using your mouse to navigate, hold down your control or option key while using your mouse to zoom in or out.
Behavioral ecology of humpback whales in the Maui Channel
This is from January of 2016. You can also watch a local news story about Dr. Cartright’s work here.
Cooks Islands 2015
Student video from our 2015 Service Learning class trip to the Cook Islands showcasing our flying and swimming robots:
We ran out of time to show all our videos, but a few of these illustrate points or projects Dr. Anderson mentioned and may be of interest:
Note: The Nature Conservancy just visited our campus two weeks ago and gave a departmental seminar about their more general coastal conservation work. You can watch that video here.
Training & Educational Resources from Pirate Lab
While beyond much of the K-12 level, if you are interested in learning more about our UAV curriculum, you can freely watch most of our class lectures, explore our robotic news curation site (this might be a great source for student research), or poke around our introductory class blog. A recent post on the first-ever drone educator conference we attended several weeks ago may also be of interest.
Drone Poll
Lastly, Dr. Anderson mentioned we have just taken our annual UAV public opinion poll live as of this weekend. If you have a few moments, please consider taking this poll and passing it along to your networks. It will be open for about six weeks and it totally anonymous.
Thanks again for all the great questions and kind words at the conference. We support tons of efforts at middle, high school, and local colleges and are always open to discussions and collaboration (we just tend to be a bit overscheduled and overcommitted…especially Dr. A). Please let us know how we might be able to help you in your teaching efforts with a class presentation, an invite for your class to tour our lab, etc.
Place has different definitions, not everyone can define place as one specific location. Some people may see place as a specific location, others may see place as their surroundings. Personally I believe place doesn’t just include your location but your surroundings, the people you’re with are a big part of my definition of place. Since I never really thought of location as something that was relevant to who I was, being able to learn GIS has been interesting to see how so many people use GIS for just about anything. After seeing the movie Crash in class it really gave me insight on how place can be used as an excuse for their actions and in the movie most of the characters blame their neighborhoods for how they are. Their excuse was that because of the place they lived they had to change to be stronger. Specifically Anthony and Peter, they were two men who thought that because they were black and the place where they came from they were judged and cast aside. Since they were angry for being discriminated on they choose to be criminals, and ruined their own lives. What was worst was that they didn’t take any responsibilities for their actions and instead blamed the place they came from and everyone else for their problems. Instead they should’ve realized that their problems weren’t an outcome of where they lived but of their surroundings and the people they associated with, because in the end if their mind was in the right place they could’ve accomplished so many things.
I realized that so many people believe the same thing because I hear people say that if they lived somewhere else things would be different. It’s sad to think that people truly believe that place defines them.
The only time I define place as a location is when looking at data or factual information. Place defined as location has no deeper meaning other than a specific location. When thinking of location I usually think of the surroundings, meaning the environment. Geography means gathering information about the environment and about human society. A geographic information system or geographical information system (GIS) is a system designed to capture, store, manipulate, analyze, manage, and present all types of geographical data. GIS can be used to do all types of research, but since I want to be a Pediatrician one of the things I could use GIS is to map out the places that need more medical aid. Another thing I could use GIS is to determine places that have more diseases and have children with low immunity.
While looking for information about biology and GIS I came upon two specific articles, containing information about medical aid. Health care facilities at any region can be divided into two main types that are known as primary health centers and hospitals. The former provides basic health care services and the latter provides services for specific health treatment. Health authorities have always aimed to provide health care for all residents by using a fair access policy that provides the right service at the right time in the right place. There are several issues that make it difficult for it to be successful. One of these issues is related to the relationship between distance to health services and the need for health care. The use of health services influenced also by other factors including financial status, time constrains, social inconveniences and the journey to the health services. In order to explore these issues, Geographical Information Systems (GIS) are used by health planners in several studies. These studies have concluded that GIS is a useful technology for analyzing and manipulating health data. The first article is information on how many good quality healthcare there is in low income urban neighborhoods in Columbus, Ohio. As opposed to most of the high quality clinics that are expensive and are conveniently placed near the wealthier neighborhoods. According to the article many residents bypass local low quality health clinics. This takes a huge effect on healthcare accessibility and because of the low quality so many people prefer to treat themselves than go with a professional medic. Low income neighborhoods seem to struggle with so many health issues. A specific solution to this issue is locating low cost but high quality health clinics. Of course not many people would agree since sadly a good part of our society are money based human beings and would immediately deny this particular solution because of how it would impact the economy. Helping neighborhoods with low quality health clinics could really help our society in general. What’s ironic is that people fail to understand that most viruses are contagious and eventually if not cured will continue to spread and infect others. Technically, if certain places can’t control viruses then eventually the virus will spread and it will cause a bigger impact on the economy. Which is why it’s more beneficial for everyone to have good quality clinics at a low cost so that low income neighborhoods can have assured access to treatment.
The second article was about mapping cancer and doing research into possible causes of cancer and how it can be prevented. Its high mortality rate, the disabilities it leaves behind and the high cost of medication are the causes of heavy loss in national economy and labor. Cancer maps can provide important clues concerning geographic variability in the incidence, mortality, or treatment of cancer. By using GIS it can work by linking data to maps, via a geographical or spatial link. This spatial link could consist of a point that could be on a map, derived by linking a patient postcode to a grid reference. Alternatively, the spatial link could be a summary of data, aggregated to a geographical area, such as a census or electoral ward. Summary data for each ward can then be linked to the appropriate ward on a map. The tremendous potential of GIS to benefit the health care industry is just now beginning to be realized. Both public and private sectors are developing innovative ways to harness the data integration and spatial visualization power of GIS. Not only can GIS work to map out cancer but also it can be used to map the chances of sick children in specific locations and it would simplify the detection of which location is has the highest probability to have sick children. With this information Pediatricians can be assigned to help children be healthier and more health clinics could be built in these locations to overall help the society.
Overall, there are so many other ways that GIS can be a helpful tool when trying to tie my career path with place. Even though I believe place isn’t relevant to who you are as a person place still matters and is important not only for my discipline but for others as well. Maybe if the opportunity presents itself and I’m able to make a difference and help children I might make my own project into helping children and using GIS will help me choose which place needs the most help and I’ll go there and make a difference.
Works Cited
Elebead, F. M. “Mapping Cancer Disease Using Geographical Information System (GIS) in.” Gezira State-Sudan. 08 Jan. 2012. Web. 18 Feb. 2016.
Murad, Abdulkader A. “Creating a GIS Application for Health Services at Jeddah City.” ScienceDirect. 2006. Web. 18 Feb. 2016.
https://cikeys.com/wp-content/uploads/2026/09/ci-logo-ciKeys.png00Jailene Rodriguezhttps://cikeys.com/wp-content/uploads/2026/09/ci-logo-ciKeys.pngJailene Rodriguez2016-02-28 05:11:562016-02-28 05:11:56The Definition of Place